
Fig. 2
- ID
- ZDB-FIG-251218-13
- Publication
- Ide et al., 2025 - Secreted Frizzled-Related Protein 1a regulates hematopoietic development in a dose-dependent manner
- Other Figures
- All Figure Page
- Back to All Figure Page
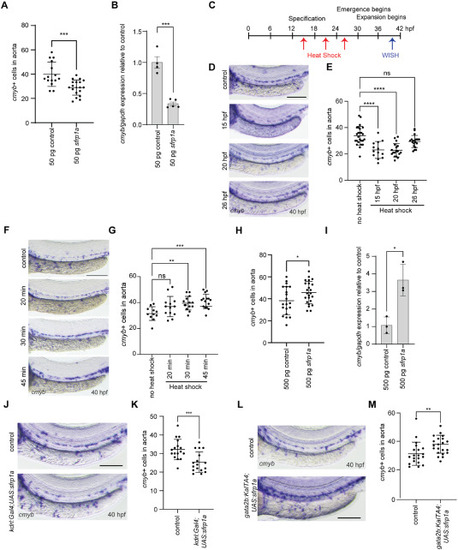
sfrp1a expression prior to HSPC emergence influences HSPC development. A. AB∗ embryos were injected with 50 pg control mRNA or 50 pg sfrp1a mRNA, fixed at 40 hpf, and analyzed by WISH for cmyb (n = 15 and 19 biological replicates from left to right). Each dot represents a biological replicate, the bars represent the mean and the error bars represent the standard deviation. Two-tailed student's T-test, ∗∗∗p < 0.001. B. AB∗ embryos were injected with 50 pg control mRNA or 50 pg sfrp1a mRNA and expression of cmyb was analyzed using qPCR (n = 5 fish for each biological replicate, 3 biological replicates). Two-tailed student's T-test, ∗∗∗p < 0.001. C. Schematic of heat shock regimen during important HSPC developmental time windows. D. Representative images of hsp:sfrp1a fish that were heat shocked at 15 hpf, 20 hpf, or 26 hpf for 30 min at 35 °C, fixed at 40 hpf, and analyzed by WISH for cmyb. Scale bar = 100 μm. E. Quantification of D (n = 25, 13, 18, 19 biological replicates from left to right). Each dot represents a biological replicate, the bars represent the mean and the error bars represent the standard deviation. One-Way ANOVA with post hoc Tukey comparisons, ∗∗∗∗p < 0.0001. F. Representative images of hsp:sfrp1a fish that were heat shocked at 20 hpf for 20, 30, and 45 minutes (min) at 37 °C, fixed at 40 hpf, and analyzed by WISH for cmyb. Scale bar = 250 μm G. Quantification of F (n = 11, 12, 14, 15 biological replicated from left to right.) Each dot represents a biological replicate, the bars represent the mean and the error bars represent the standard deviation. One-Way ANOVA with post hoc Tukey comparisons, ∗∗p < 0.01, ∗∗∗p < 0.001. H. AB∗ embryos were injected with 500 pg control mRNA or 500 pg sfrp1a mRNA, fixed at 40 hpf, and analyzed by WISH for cmyb (n = 20 and 24 biological replicates from left to right). Each dot represents a biological replicate, the bars represent the mean and the error bars represent the standard deviation. One-Way ANOVA with post hoc Tukey comparisons, ∗p < 0.05. I. AB∗ embryos were injected with 500 pg control mRNA or 500 pg sfrp1a mRNA and expression of cmyb was analyzed using qPCR (n = 5 fish for each biological replicate, 3 biological replicates). Two-tailed Student's, ∗p < 0.05. J. Representative images of kdrl:Gal4 fish that were crossed with UAS:sfrp1a fish, fixed at 40 hpf, and analyzed by WISH for cmyb. Control fish are non-transgenic siblings. Scale bar = 100 μm. K. Quantification of J (n = 17 biological replicates). Each dot represents a biological replicate, the bars represent the mean and the error bars represent the standard deviation. Two-tailed Student's, ∗∗∗p < 0.001. L. Representative images of gata2b:KalTA4 fish crossed with UAS:sfrp1a fish, fixed at 40 hpf, and analyzed by WISH for cmyb. Control fish are non-transgenic siblings. Scale bar = 100 μm. M. Quantification of L (n = 20 and 21 biological replicates from left to right). Each dot represents a biological replicate, the bars represent the mean and the error bars represent the standard deviation. Two-tailed Student's, ∗∗p < 0.01. |
Reprinted from Developmental Biology, , Ide, A.D., Carpenter, K.A., Elaswad, M.T., Opria, K., Marcellin, K., Gilliland, C., Grainger, S., Secreted Frizzled-Related Protein 1a regulates hematopoietic development in a dose-dependent manner, , Copyright (2025) with permission from Elsevier. Full text @ Dev. Biol.