|
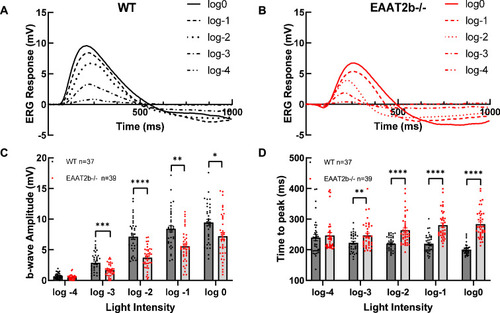
eaat2b mutant zebrafish larvae exhibit reduced ERG b-wave amplitude and impaired response kinetics. Representative ERG responses of WT controls (A) and eaat2b mutants (B) at different flash intensities. (C) Quantification of the b-wave amplitude across five different light intensities. eaat2b−/− larvae (in red) show a significant reduction in ERG b-wave amplitudes compared to WT controls (in black). Statistical significance: p = 0.0142 at log 0, p = 0.0013 at log −1, p < 0.0001 at log −2, p = 0.0005 at log −3 and p = 0.0771 at log −4. In addition, the time to peak was quantified (D). Statistical significance of time to peak: p = 0.6161 at log −4, p = 0.0074 at log −3, p < 0.0001 at log −2, p < 0.0001 at log −1 and p < 0.0001 at log 0. Statistical analysis was performed using t-tests and nonparametric tests in GraphPad Prism, v. 8. Data are presented as mean ± s.e.m. Significance levels are indicated as follows: *p < 0.05; **p < 0.01; ***p < 0.001; ****p < 0.0001.
|