FIGURE

FIGURE 8

ID
ZDB-FIG-251115-170
Publication
Bolanos-Palmieri et al., 2025 - Kynurenine Pathway Dysregulation Impairs Podocyte Morphology and Bioenergetics In Vitro and Leads to Glomerular Dysfunction
Other Figures
All Figure Page
Back to All Figure Page
FIGURE 8

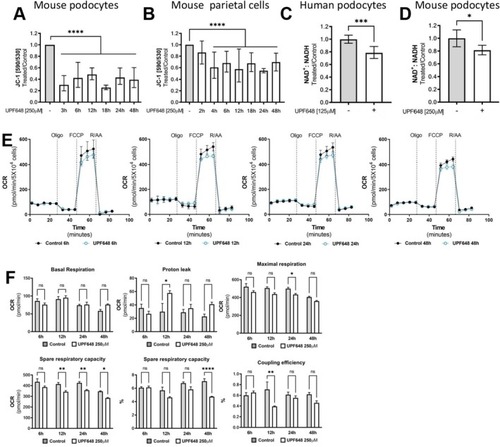
Changes in cellular energy and redox homeostasis in cultured podocytes after KMO inhibition. Murine glomerular cells were treated with the KMO inhibitor UPF648 and different aspects of mitochondrial health and bioenergetic parameters were assessed. Changes in the spectral profile of the mitochondrial dye JC‐1 show that upon KMO inhibition, both (A) podocytes and (B) parietal cells have an increase in mitochondrial membrane depolarization. Data is presented as the ratio between 590/530 nm relative to the control for each of the time points shown. Bars represent the geometric mean ± geometric SD from 3 to 13 wells pooled from 3 to 4 independent experiments for each cell type (**p ≤ 0.01, ****p ≤ 0.0001; groups were compared using one‐way ANOVA and Holm–Šídák multiple comparison post hoc test). The redox state of the NAD cofactor was assessed using a plate‐based assay that allows for the separate quantification of NAD+ and NADH. For this, the podocytes were allowed to differentiate under nonpermissive conditions and then treated with UPF648. Both human (C) and mouse (D) podocytes show a significant reduction in the NAD+/NADH ratio as a consequence of KMO inhibition. Bars indicate the geometric mean of values from two independent experiments ± geometric SD expressed as a fold‐change relative to controls (*p < 0.05, ***p ≤ 0.001; unpaired t‐test). (E) Oxygen consumption rate (OCR) traces and (F) summary of mitochondrial bioenergetic parameters extracted from the seahorse traces for each time point of KMO inhibition by UPF648 in adherent mouse podocytes. Data presented as the average of 4–5 wells per time point ± SEM (n.s. = nonsignificant, *p < 0.05, **p ≤ 0.01, ***p ≤ 0.001, ****p ≤ 0.0001; one‐way ANOVA and Holm–Šídák multiple comparison post hoc test). FCCP, Carbonyl cyanide‐4 (trifluoromethoxy) phenylhydrazone; Oligo, Oligomycin; R/AA, Rotenone and Antimycin A.

Expression Data

Expression Detail
Antibody Labeling
Phenotype Data

Phenotype Detail
Acknowledgments
This image is the copyrighted work of the attributed author or publisher, and ZFIN has permission only to display this image to its users. Additional permissions should be obtained from the applicable author or publisher of the image. Full text @ FASEB J.