
Fig. 2
- ID
- ZDB-FIG-251107-58
- Publication
- Leach et al., 2025 - Macrophage/microglia-dependent mechanisms drive retinal pigment epithelium regeneration in zebrafish
- Other Figures
- All Figure Page
- Back to All Figure Page
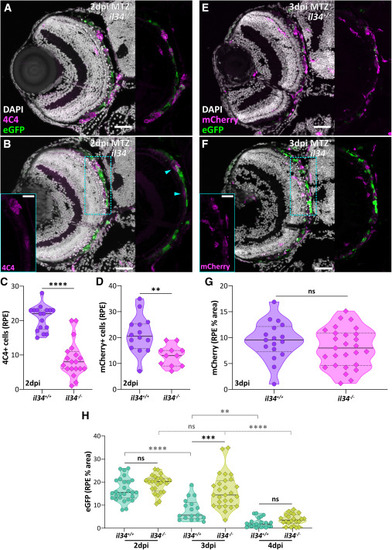
Macrophage/microglia presence in the RPE injury site is delayed in il34 mutants (A and B) Transverse confocal micrographs showing 4C4 (magenta) labeling in 2 dpi ablated (MTZ+) (A) il34+/+ and (B) il34−/− larvae. (B) Digital zoom inset (cyan outlines) and cyan arrowheads highlight 4C4+ cells in the il34−/− animal. (C and D) Violin plots showing a significant decrease in (C) 4C4+ cells and (D) mCherry+ cells in the RPE of ablated (MTZ+) il34−/− larvae at 2 dpi. (E and F) Transverse confocal micrographs showing mCherry (magenta) labeling in 3 dpi ablated (MTZ+) (E) il34+/+ and (F) il34−/− larvae. Digital zoom inset (cyan outlines) highlights mCherry+ cells in the il34−/− animal. (G) Violin plots showing no significant difference in RPE-localized mCherry expression (% area) between ablated (MTZ+) il34+/+ and il34−/− larvae at 3 dpi. (H) Violin plots showing eGFP retention (% area) in ablated (MTZ+) il34+/+ and il34−/− RPE at 2, 3, and 4 dpi. Micrographs from (A, B, E, and F) are also shown in Figures S4A and S4B (eGFP channel only). DAPI = nuclei (white); rpe65a:nfsB-eGFP = RPE (green). Scale bars, 40 μm; digital zoom scale bars, 20 μm; ns, not significant; ∗∗p ≤ 0.01; ∗∗∗p ≤ 0.001 and ∗∗∗∗p ≤ 0.0001. Experimental replicates and statistical information can be found in Table S3. |