
Fig. 4
- ID
- ZDB-FIG-251106-31
- Publication
- Boiti et al., 2025 - Light-Induced Transcription in Zebrafish Targets Mitochondrial Function and Heme Metabolism
- Other Figures
- All Figure Page
- Back to All Figure Page
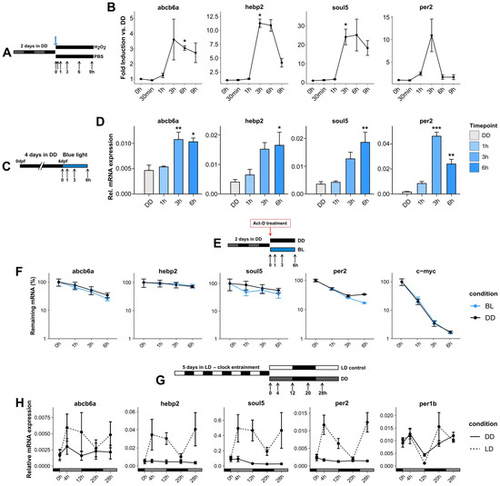
Upregulation of mitochondrial and heme genes is an organism-wide response, dependent on de novo transcription and clock-independent. (A) Experimental design for exposure of PAC-2 cells to H2O2. PAC-2 cells were kept in darkness for two consecutive days, followed by treatment with 300 μM H2O2, and were then maintained in darkness until collection at timepoints indicated as hours (h) following the addition of H2O2 to the cultures. A set of cells treated with PBS was sampled in parallel in darkness in order to control for any time-dependent changes in gene expression in the cell cultures that might occur independently of exposure to ROS. (B) RT-qPCR of ROS-induced expression of selected upregulated genes in PAC-2 cells. Values are represented by mean ± SEM (N = 3) of fold induction of treatment vs. control. One-way ANOVA followed by Tukey’s HSD post hoc multiple comparison tests was performed against the control results. (C) Experimental design for blue light exposure of 4 dpf zebrafish embryos. Zebrafish embryos were raised for 96 h in complete darkness, followed by exposure to 468 nm blue light for up to six hours. During illumination, samples were harvested periodically at timepoints indicated as hours (h) following the start of exposure to blue light. (D) Relative mRNA expression of abcb6a, hebp2, soul5, and per2 in response to blue light in zebrafish embryos. Values are represented by mean ± SEM (N = 3). One-way ANOVA followed by Tukey’s HSD post hoc multiple comparison tests was performed against the DD control results. p < 0.5, p < 0.01, and p < 0.001 are represented by *, **, and ***, respectively. (E) Experimental design for mRNA stability of genes following blue light exposure. Zebrafish cells were treated with Actinomycin-D (5 µg/mL) before exposure. During illumination, samples were harvested periodically at timepoints indicated as hours (h) following the start of the combined Actinomycin-D treatment and exposure to blue light. (F) RT-qPCR analysis of abcb6a, hebp2, soul5, and per2, under blue light (blue) and in darkness (black). c-myc expression is measured to serve as a positive control for Actinomycin-D treatment. Data are plotted as the percentage (mean) of remaining mRNA ± SEM (N = 3) compared to cells not treated with actinomycin-D (0 h) on the y-axis. Expression levels in the two lighting conditions and across timepoints are compared via two-way ANOVA. (G) Experimental design for assaying circadian clock regulation. Zebrafish cells were entrained to 12 h:12 h light:dark cycles (LD) for five days, followed by one more day in LD or complete darkness (DD). Samples were harvested periodically at the indicated timepoints, in hours (h), following the start of the final LD cycle or the transfer to DD conditions. (H) RT-qPCR analysis of abcb6a, hebp2, and soul5, as well as per2, a light-regulated clock gene, and per1b, a clock-regulated gene. Relative mRNA expression of cells kept in LD (dashed line) or DD at different timepoints (x-axis) is plotted on the y-axis as mean ± SEM (n = 3). Detailed statistical analysis and the data for this figure can be found in Supplementary Dataset S1. |