
Fig. 3
- ID
- ZDB-FIG-251106-30
- Publication
- Boiti et al., 2025 - Light-Induced Transcription in Zebrafish Targets Mitochondrial Function and Heme Metabolism
- Other Figures
- All Figure Page
- Back to All Figure Page
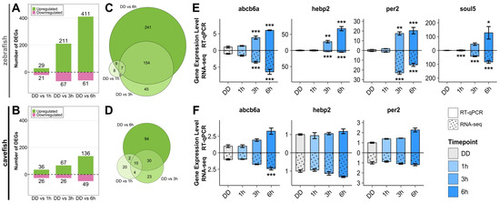
Transcriptome of zebrafish PAC-2 (top) and cavefish EPA (bottom) cell lines exposed to blue light. (A,B) Number of significantly up- and downregulated genes at 1 h, 3 h, and 6 h, compared to nonexposed samples (0 h, DD) for zebrafish (A) and cavefish (B) cells following the de novo pipeline represented in Figure 1. (C,D) Venn diagrams show significantly upregulated genes among the three comparison groups for zebrafish (469 genes) (C) and cavefish (183 genes) cells (D). (E,F) mRNA sequencing and RT-qPCR validation of blue light-induced expression of selected upregulated genes in zebrafish (E) and cavefish (F) cells. In each graph, RT-qPCR data are plotted above the x-axis and RNA-seq data below (dotted bars). Values are represented by mean ± SEM of fold induction (n = 3). One-way ANOVA followed by Tukey’s HSD post hoc multiple comparison tests against the DD control results can be found in Supplementary Dataset S1. p < 0.5, p < 0.01, and p < 0.001 are represented by *, **, and ***, respectively. |