
Fig. 2
- ID
- ZDB-FIG-251106-29
- Publication
- Boiti et al., 2025 - Light-Induced Transcription in Zebrafish Targets Mitochondrial Function and Heme Metabolism
- Other Figures
- All Figure Page
- Back to All Figure Page
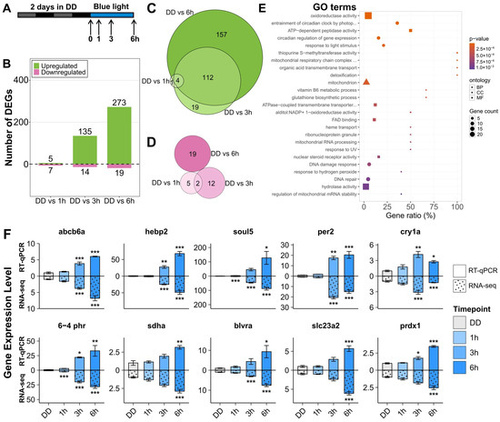
Transcriptome of zebrafish PAC-2 cells exposed to blue light. (A) Experimental design. Cells were initially maintained in darkness for two days to dampen clock- and light-dependent gene expression before exposure to 468 nm blue light for up to six hours. Following RNA extraction at the indicated timepoints and subsequent sequencing, the RNA-seq data were analyzed according to the “standard” pipeline represented in Figure 1. (B) Number of significantly up- and downregulated genes at 1 h, 3 h, and 6 h compared to unexposed samples (0 h, DD). (C,D) Venn diagrams show significantly upregulated (293 genes, (C)) and downregulated (38 genes, (D)) genes among the three comparison groups. (E) Top 25 enriched GO terms for DEGs at 6 h vs. DD in PAC-2 cells. The percentage of upregulated genes within their specific category is indicated on the x-axis. Size indicates the number of upregulated genes for each term; shape indicates the ontology (BP: biological process; CC: cellular component; MF: molecular function), and color indicates the adjusted p-value from high (blue) to low (red). (F) RT-qPCR validation of blue light-induced expression of selected upregulated genes. In each graph, RT-qPCR data are plotted above the x-axis, and RNA-seq data are below (dotted bars). Values are represented by mean ± SEM of fold induction (n = 3). One-way ANOVA followed by Tukey’s HSD post hoc multiple comparison tests against the DD control results can be found in Supplementary Dataset S1. p < 0.5, p < 0.01, and p < 0.001 are represented by *, **, and ***, respectively. |