|
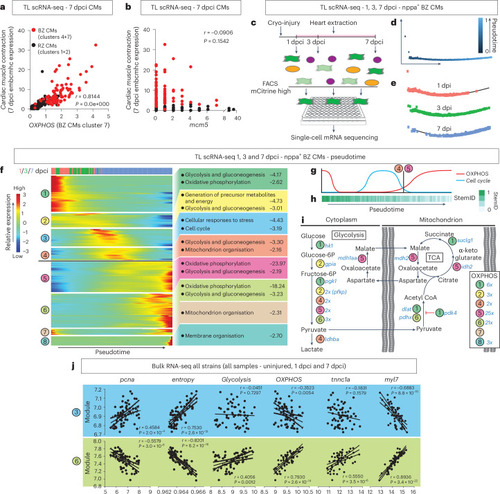
Cardiomyocyte proliferation is separated in time from OXPHOS and cardiomyocyte re-differentiation. a,b, Positive correlation of cardiac muscle contraction genes in cardiomyocytes to OXPHOS (a) but not to proliferation marker mcm5 (b) by reanalyzing previous scRNA-seq data from Honkoop et al.13. Red indicates border zone cardiomyocytes; clusters are as in the original publication. c, Schematic diagram of the scRNA-seq procedure using the transgenic TgBAC(nppa:mCitrine) line to FACS 1 dcpi, 3 dcpi and 7 dpci border zone cardiomyocytes. d, Timeline generated by pseudotime analysis of the 1 dcpi, 3 dcpi and 7 dpci border zone cardiomyocytes. e, Pseudotime analysis recapitulates the real-time order of the samples. f, Differentially expressed genes changing over pseudotime, grouped into eight modules using unsupervised hierarchical clustering. Each module was analyzed for enriched processes. g, Schematic to indicate how levels of OXPHOS and Cell cycle genes alternate. h, StemID analysis shows that the cardiomyocytes differentiate along the pseudotime. i, Sequential activation of Glycolysis, TCA cycle, MAS and OXPHOS genes based on pseudotime analysis. j, Correlation graphs of strain bulk RNA-seq data comparing significantly expressed genes in modules 3 and 6 with proliferation (pcna), differentiation state (entropy), Glycolysis, OXPHOS, tnnc1 (correlates to border zone embcmhc expression) and myl7 (mature cardiomyocyte marker). Data showing positive correlation between proliferation and de-differentiation with module 3 but negative correlation to module 6. OXPHOS and myl7 have the opposite pattern. Embryonic border zone marker tnnc1a only positively correlates to module 6 and, thus, the re-differentiation stage. d–f,h, n = 4 hearts per timepoint. a,b,j, Simple linear regression. BZ, border zone; CM, cardiomyocyte; RZ, remote zone.
|