|
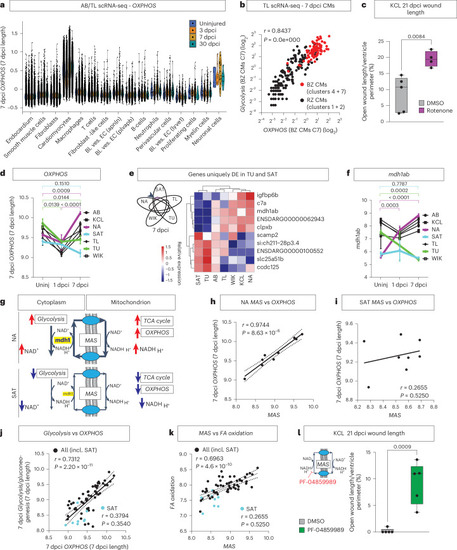
Upregulation of the MAS drives OXPHOS and regeneration. a, OXPHOS gene expression is highest in cardiomyocytes compared to other cell types in scRNA-seq of AB/TL—reanalysis of Hu et al.27. b, Positive correlation between Glycolysis and OXPHOS in 7 dpci cardiomyocytes, with highest levels of both in the border zone cardiomyocytes (red), by reanalyzing scRNA-seq data of TL published previously by Honkoop et al.13. Clusters 1, 2, 4 and 7 refer to the clustering in the original publication. c, Increased wound length in KCL treated with rotenone in comparison to DMSO control at 21 dpci. d, Temporal pattern of OXPHOS gene expression in the bulk RNA-seq data. e, Venn diagram indicating uniquely differentially expressed (DE) genes in TU and SAT (AB and KCL not shown but included in analysis) with heatmap of the top DE genes in the bulk RNA-seq identifying mdh1ab uniquely downregulated in TU and SAT versus the other strains. f, Expression pattern of mdh1ab over time in the bulk RNA-seq data of the strains. g, Schematic diagram indicating the influence of activated MAS on maintaining cytosolic and mitochondrial balance of NAD+/NADH in NA versus SAT. h,i, Positive correlation between the MAS and OXPHOS in the NA strain (h) but not the SAT strain (i). j,k, Positive correlation of Glycolysis with OXPHOS (j) and MAS versus Fatty Acid (FA) oxidation (k) in all strains but absence of correlation in SAT. l, Wound length quantification showing increased 21 dpci wound length in KCL hearts treated with MAS inhibitor PF-04859989 in comparison to DMSO control. c, Rotenone n = 4, DMSO n = 5 (biological replicates); d,f, uninjured: n = 3 per strain, 1 dpci: SAT, TU n = 2, AB, NA, TL, WIK, KCL n = 3, 7 dpci n = 3 per strain (biological replicates); e, n = 3 biological replicates per strain; l, n = 5 biological replicates per group. b,h–k, Simple linear regression. c,l, Unpaired two-tailed Student’s t-test. d,f, Two-way ANOVA with Tukey’s test; data presented as mean ± s.e.m. Bl. ves. EC, blood vessel endothelial cell; BZ, border zone; C, cluster; CM, cardiomyocyte; incl., including; RZ, remote zone; Uninj, uninjured. Source data
|