
Fig. 4
- ID
- ZDB-FIG-251002-46
- Publication
- Lau et al., 2025 - Supraspinal commands have a modular organization that is behavioral context specific
- Other Figures
- All Figure Page
- Back to All Figure Page
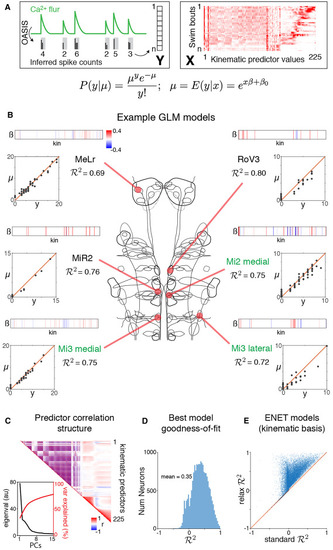
Single-neuron modeling (A) For each neuron, a spike count was inferred for each swim bout (vector Y, left) and kinematic predictor values were computed for the same n bouts (matrix X, right). Generalized linear regression was used to model expected spike counts, μ, as a function of motor kinematic predictors, x, assuming spikes follow a Poisson distribution. For further details see STAR Methods. (B) Example models. For each cell, we show the fitted model coefficients (β), goodness of fit (cross-validated fraction of deviance explained, ), and OASIS-inferred spikes (y) versus the model prediction (μ). Red lines have a unity slope. Note that β is represented as a row vector here and in subsequent figures, for visualization. (C) Correlation matrix for all 225 kinematic predictors. Inset shows eigenvalues and cumulative variance explained by top principal components. (D) Distribution of best regression model , for all neurons. (E) Comparison of (for models fitted in the basis of motor kinematics) either with or without relaxation. Relaxing model coefficients improves cross-validated performance. |