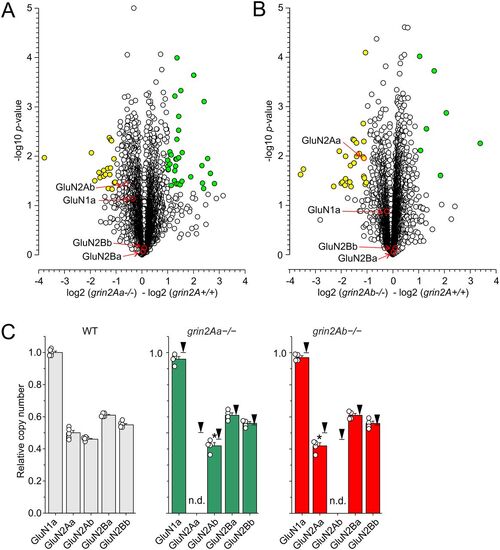
Proteomic analysis of the optic tectum from grin2A+/+, grin2Aa−/−, and grin2Ab−/− adult fish. The volcano plots show proteomics data. The abscissa displays negative (downregulated) and positive (upregulated) fold changes in the ratio of protein levels found in grin2Aa−/− relative to grin2A+/+ (A) and grin2Ab−/− relative to grin2A+/+ (B). The statistical significance (-log of p values; indicated on the ordinate) was assessed using two-sample test with the level of significance determined using permutation-based FDR (see Materials and Methods for details). Yellow symbols show proteins with significantly downregulated expression and green symbols show proteins with significantly upregulated expression (see Extended Data Figs. 8-1, 8-2 for details of proteins with altered expression). C, The plots show the relative CAN of GluN1a, GluN2Aa, GluN2Ab, GluN2Ba, and GluN2Bb expressed in grin2A+/+ (on the left), grin2Aa−/− (in the middle), and grin2Ab−/− fish (on the right). CAN of individual NMDAR subunits was normalized with respect to CAN of GluN1a assessed in the grin2A+/+ fish. Black arrows indicate relative expression in the grin2A+/+ fish; n.d. stands for not detected. One-way ANOVA was used to assess the significance in the relative CAN of NMDAR subunits. Relative CAN of GluN2Aa and GluN2Ab were significantly changed when compared with grin2A+/+ (*). For proteomic analysis of selected presynaptic proteins, see Extended Data Figure 8-3.
|
