
Fig. 2
- ID
- ZDB-FIG-250819-12
- Publication
- Chen et al., 2025 - Contraction-induced endocardial id2b plays a dual role in regulating myocardial contractility and valve formation
- Other Figures
- All Figure Page
- Back to All Figure Page
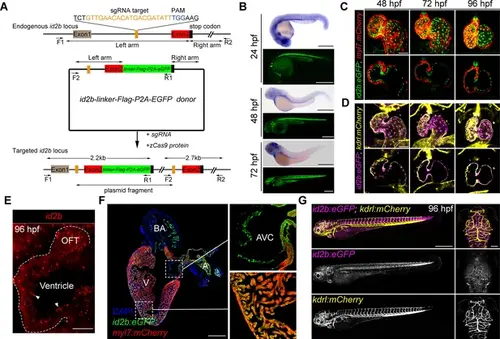
The spatiotemporal expression of id2b. (A) Schematic of the intron targeting-mediated eGFP knock-in at the id2b locus using the CRISPR-Cas9 system. The sgRNA targeting sequence and the protospacer adjacent motif (PAM) sequence are shown in orange and blue, respectively. The donor plasmid comprises left and right arm sequences and a linker-FLAG-P2A-eGFP cassette denoted by black lines with double arrows and green box, respectively. The linker-FLAG-P2A-eGFP cassette was integrated into the id2b locus upon co-injection of the donor plasmid with sgRNA and zCas9 protein, enabling detection by PCR using two pairs of primers (F1, R1 and F2, R2) - the former length yielding a length of about 2.2 kb and the latter about 2.7 kb. (B) Zebrafish id2b expression pattern, as indicated by in situ hybridization of embryos at designated time points, was consistent with the fluorescence localization of id2b:eGFP, revealing expression in the heart, brain, retina, notochord, pronephric duct, and other tissues. (C) Maximum intensity projections (top) and confocal sections (bottom) of id2b:eGFP; Tg(myl7:mCherry) hearts at designated time points. (D) Maximum intensity projections (top) and confocal sections (bottom) of id2b:eGFP; Tg(kdrl:mCherry) embryos at specific time points. Magenta, id2b:eGFP; yellow, kdrl:mCherry. (E) RNAscope analysis of id2b in 96 hr post-fertilization (hpf) embryonic heart. White dashed line outlines the heart. OFT, outflow tract. (F) Immunofluorescence of adult id2b:eGFP; Tg(myl7:mCherry) heart section (left panel). Enlarged views of boxed areas are shown in the right panel. Green, eGFP; red, mCherry; blue, DAPI. BA, bulbus arteriosus; V, ventricle; A, atrium; AVC, atrioventricular canal. (G) Confocal z-stack maximum intensity projection of id2b:eGFP;Tg(kdrl:mCherry) embryos at 96 hpf showing the whole body (lateral view) and the head (top view). Scale bars, 500 μm (B, F, left, and G), 50 μm (C and D), 25 μm (E), 100 μm (G, right). |