|
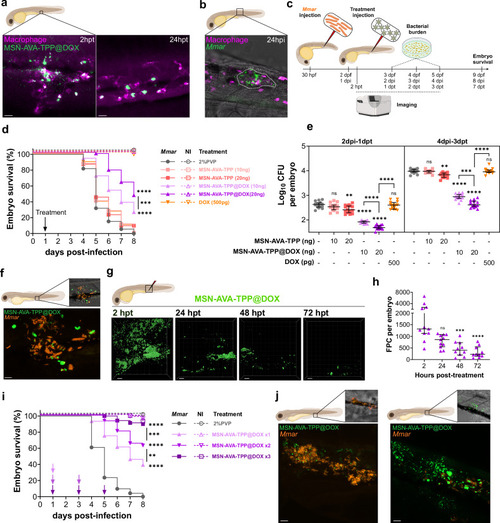
Effect of MSN-AVA-TPP@DOX on infected zebrafish embryos with M. marinum. a Localization of MSN-AVA-TPP@DOX after injection in embryos, 2 h post-treatment (hpt) and 24 hpt. Scale bar: 15 µm. b Representative image of an embryo with a pre-granuloma at 24 h post-injection (hpi). Scale bar: 20 µm. c Schematic representation of the protocol used. d Survival curve of infected embryos (full lines) with the different treatments injected at 24 hpi. Asterisks next to lines correspond to comparison with respective control (Dashed lines). p values: ****p < 0.0001, *** p = 0.0005. e Bacterial burden from individual infected embryos with different treatments, at 2 dpi and 4 dpi. Median and interquartile range are shown (n = 15). Comparisons were done using ordinary one-way ANOVA with Šídák’s multiple comparisons test. Asterisks above each data set correspond to comparison to non-treated condition. Adjusted p values (from left to right): 2 dpi: ns p > 0.9999, **p = 0.0014, ****p < 0.0001; 4 dpi: ns p = 0.3739, **p = 0.0020, ****p < 0.0001, ns p = 0.9990, ***p = 0.0001. f Localization of MSN-AVA-TPP@DOX within an infection site at 24 hpt. Scale bar: 5 µm. g Kinetics of MSN-AVA-TPP@DOX after injection in embryos from 2 to 72 hpt. Images show 3D representation of z-stack confocal images. Scale bar: 20 µm. h Quantification of MSN-AVA-TPP@DOX in embryos by fluorescent pixel counts (FPC). Median is shown with interquartile range (n = 12). Comparisons were done using Kruskal-Wallis with Dunn’s multiple comparisons test. Asterisks above each data set correspond to comparison with 2 hpt. Adjusted p values: ns p = 0.1517, ***p = 0.0005, ****p < 0.0001. i Survival curve of infected embryos with either one, two or three doses of MSN-AVA-TPP@DOX (20 ng). Arrows indicate the time of treatment. Asterisks next to lines correspond to comparison with respective control. p values: **p = 0.0020, ***p = 0.0004, ****p < 0.0001. j Representative images of infection foci in infected embryos treated with either one dose of MSN-AVA-TPP@DOX or 3 doses, after 48 h of the last treatment. Scale bar: 10 µm. a-b-d-e-f-g-h-i-j Three independent experiments were performed with (d–i) n = 24 per condition and per experiment, comparisons were done using a log-rank (Mantel-Cox) test (n = 72 per condition), (e) n = 5 per condition per timepoint per experiment, (g, h) n = 4 per condition and per experiment (n = 16 per condition). Created in BioRender. Kremer, L. (2025) https://BioRender.com/h2chy8w. Source data are provided as a SourceData file.
|