IMAGE

Fig. 6

ID
ZDB-IMAGE-250814-19
Source
Figures for Aguilera-Correa et al., 2025
Image
Figure Caption

Fig. 6 
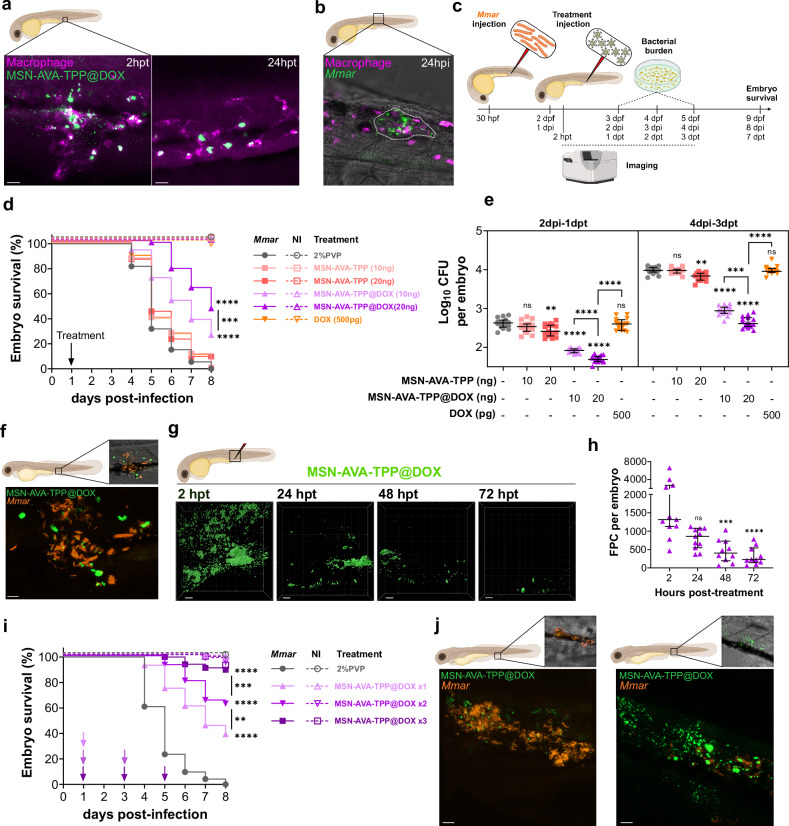
Effect of MSN-AVA-TPP@DOX on infected zebrafish embryos with M. marinum.

a Localization of MSN-AVA-TPP@DOX after injection in embryos, 2 h post-treatment (hpt) and 24 hpt. Scale bar: 15 µm. b Representative image of an embryo with a pre-granuloma at 24 h post-injection (hpi). Scale bar: 20 µm. c Schematic representation of the protocol used. d Survival curve of infected embryos (full lines) with the different treatments injected at 24 hpi. Asterisks next to lines correspond to comparison with respective control (Dashed lines). values: ****p < 0.0001, *** p = 0.0005. e Bacterial burden from individual infected embryos with different treatments, at 2 dpi and 4 dpi. Median and interquartile range are shown (n = 15). Comparisons were done using ordinary one-way ANOVA with Šídák’s multiple comparisons test. Asterisks above each data set correspond to comparison to non-treated condition. Adjusted values (from left to right): 2 dpi: ns p > 0.9999, **p = 0.0014, ****p < 0.0001; 4 dpi: ns p = 0.3739, **p = 0.0020, ****p < 0.0001, ns p = 0.9990, ***p = 0.0001. f Localization of MSN-AVA-TPP@DOX within an infection site at 24 hpt. Scale bar: 5 µm. g Kinetics of MSN-AVA-TPP@DOX after injection in embryos from 2 to 72 hpt. Images show 3D representation of z-stack confocal images. Scale bar: 20 µm. h Quantification of MSN-AVA-TPP@DOX in embryos by fluorescent pixel counts (FPC). Median is shown with interquartile range (n = 12). Comparisons were done using Kruskal-Wallis with Dunn’s multiple comparisons test. Asterisks above each data set correspond to comparison with 2 hpt. Adjusted p values: ns p = 0.1517, ***p = 0.0005, ****p < 0.0001. i Survival curve of infected embryos with either one, two or three doses of MSN-AVA-TPP@DOX (20 ng). Arrows indicate the time of treatment. Asterisks next to lines correspond to comparison with respective control. p values: **p = 0.0020, ***p = 0.0004, ****p < 0.0001. j Representative images of infection foci in infected embryos treated with either one dose of MSN-AVA-TPP@DOX or 3 doses, after 48 h of the last treatment. Scale bar: 10 µm. a-b-d-e-f-g-h-i-j Three independent experiments were performed with (di) n = 24 per condition and per experiment, comparisons were done using a log-rank (Mantel-Cox) test (n = 72 per condition), (e) n = 5 per condition per timepoint per experiment, (g, h) n = 4 per condition and per experiment (n = 16 per condition). Created in BioRender. Kremer, L. (2025) https://BioRender.com/h2chy8w. Source data are provided as a SourceData file.

Acknowledgments
This image is the copyrighted work of the attributed author or publisher, and ZFIN has permission only to display this image to its users. Additional permissions should be obtained from the applicable author or publisher of the image. Full text @ Nat. Commun.