
Fig. 2
- ID
- ZDB-FIG-250807-29
- Publication
- Wang et al., 2025 - EPHA4 signaling dysregulation links abnormal locomotion and the development of idiopathic scoliosis
- Other Figures
- All Figure Page
- Back to All Figure Page
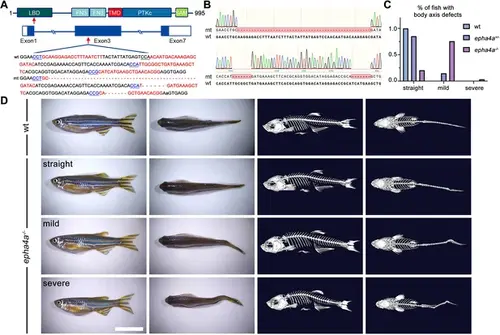
Scoliosis in zebrafish epha4a mutants. (A) Diagram of the protein domains, genomic structures, and sequences of wild-type and corresponding epha4a mutants. Red arrows indicate mutation sites. Blue boxes indicate open reading frames. Underlined sequences indicate the protospacer adjacent motif (PAM) region, and red fonts indicate Cas9 binding sites. LBD: ligand binding domain; FN3: fibronectin type 3 domain; TMD: transmembrane domain; PTKc: catalytic domain of the protein tyrosine kinases; SAM: sterile alpha motif. (B) Sanger sequencing results confirmed the deletion of the target region in epha4a mutant transcripts. (C) Bar graph showing the percentages of adult zebrafish with normal, mild, or severe body axis defects in wild-type (n=76), epha4a heterozygote (n=95), or epha4a homozygous (n=116). (D) Representative images of wild-type and homozygous epha4a mutants. Micro CT images are shown on the right. Lateral and dorsal views are shown. Scale bar: 1 cm. |