
FIGURE
Fig. 6
- ID
- ZDB-FIG-250807-21
- Publication
- Cao et al., 2025 - Spatiotemporal Super-Resolution Imaging of Lipid Metabolism Dynamics in Physiological/Pathological Conditions
- Other Figures
- All Figure Page
- Back to All Figure Page
Fig. 6
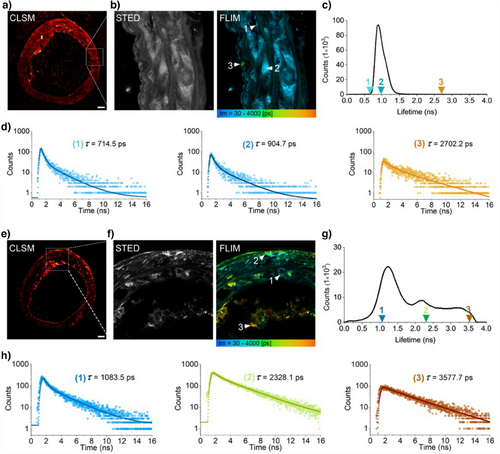
a) CLSM image of normal blood vessel wall tissue. b) Enlarged STED and FLIM images of (a). c) Fluorescence lifetime distribution corresponding to (b). d) Fluorescence lifetime spectra recorded at positions (1, 2, and 3) indicated in (b). e) STED/CLSM images and f) FLIM image of blood vessel wall with atherosclerotic plaque lesions. g) Fluorescence lifetime distribution corresponding to (f). h) Fluorescence lifetime spectra recorded at positions (1, 2, and 3) indicated in (f). Scale bar 5 µm. |
Expression Data
Expression Detail
Antibody Labeling
Phenotype Data
Phenotype Detail
Acknowledgments
This image is the copyrighted work of the attributed author or publisher, and
ZFIN has permission only to display this image to its users.
Additional permissions should be obtained from the applicable author or publisher of the image.
Full text @ Angew. Chem. Int. Ed. Engl.