
FIGURE
Fig. 5
- ID
- ZDB-FIG-250807-20
- Publication
- Cao et al., 2025 - Spatiotemporal Super-Resolution Imaging of Lipid Metabolism Dynamics in Physiological/Pathological Conditions
- Other Figures
- All Figure Page
- Back to All Figure Page
Fig. 5
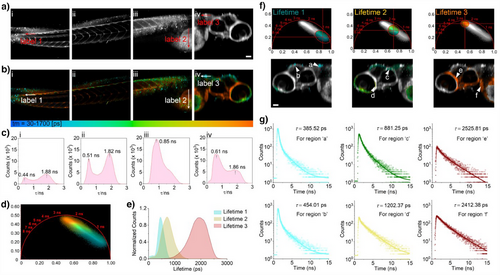
a) Confocal images and b) FLIM images of zebrafish stained with TPASe. c) Fluorescence lifetime distribution corresponding to each part of the zebrafish (i–iv). d) Overall phase diagrams and e) fluorescence lifetime distribution of different regions in the zebrafish head (Part iv of (b)). f) Cluster selection of fluorescence lifetimes in Part iv from (d and e). g) Lifetime trace: fluorescence lifetime spectra of regions “a” to “f” selected from the phase diagram cluster. Format: 1024 × 1024 pixels. Scale bar: 50 µm. |
Expression Data
Expression Detail
Antibody Labeling
Phenotype Data
Phenotype Detail
Acknowledgments
This image is the copyrighted work of the attributed author or publisher, and
ZFIN has permission only to display this image to its users.
Additional permissions should be obtained from the applicable author or publisher of the image.
Full text @ Angew. Chem. Int. Ed. Engl.