
Fig. 2
- ID
- ZDB-FIG-250807-17
- Publication
- Cao et al., 2025 - Spatiotemporal Super-Resolution Imaging of Lipid Metabolism Dynamics in Physiological/Pathological Conditions
- Other Figures
- All Figure Page
- Back to All Figure Page
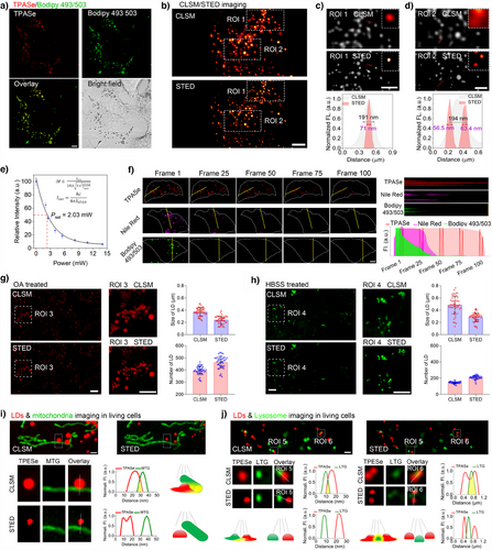
a) Colocalization of TPASe (2.5 µM) and BODIPY 493/503 (250 nM). λex/em = 488 nm/600–700 nm for TPASe (red) and λex/em = 488 nm/500–525 nm for BODIPY 493/503 (green). Scale bar: 5 µm. b) CLSM and STED imaging of LDs stained with TPASe (2.5 µM) in A549 cells. The depletion laser was 775 nm with an intensity of 2.03 mW. Scale bar: 2 µm. c) and d) Enlarged CLSM and STED images of ROI 1 and 2 in (b). Scale bar: 0.2 µm; normalized fluorescence intensity profile along the white dashed line in (b). e) STED images of TPASe (2.5 µM) in A549 cells under different depletion laser powers, with the depletion laser at 775 nm. f) Photobleaching resistance images of LDs in A549 cells stained with TPASe (red), Nile Red (magenta), and BODIPY 493/503 (green). Fluorescence gradually disappeared in the yellow dashed region with an overall curve showing continuous fluorescence recovery. g) and h) Number and size of LDs by CLSM and STED microscopy after OA (g, red), or HBSS (f, pseudo color, green) treatment for 6 h. Scale bar: 5 µm. i) CLSM and STED images of LD-mitochondrial interactions in living cells. LDs are stained with TPASe (red), and mitochondria are stained with mitochondrial tracker green (MTG, green). Normalized fluorescence intensity changes of TPASe and MTG in CLSM and STED, respectively, and schematic representation of the two modes of contact between mitochondria and LDs under CLSM and STED. Scale bar: 1 µm. j) CLSM and STED images of LDs-lysosome stained with TPASe (2.5 µM, red) and lysosome tracker green (LTG, green) in A549 cells. Enlarged ROI 5/6 of the LD contact process with lysosomes under CLSM and STED images. Normalized fluorescence intensity of four forms of LDs contacts with lysosomes under CLSM and STED, respectively, and schematic representation of the two modes of contact between lysosome and LDs under CLSM and STED. The ROS scavenger UA (50 µM) was added to avoid probe-induced lipid oxidation under light conditions. Scale bar: 1 µm. |