
FIGURE
FIGURE 3
- ID
- ZDB-FIG-250805-34
- Publication
- Bai et al., 2025 - Effects of realgar-indigo naturalis formula on a zebrafish tumor xenograft model induced by human acute promyelocytic leukemia cells: antitumor activity, hepatotoxicity, and transcriptomic analysis
- Other Figures
- All Figure Page
- Back to All Figure Page
FIGURE 3
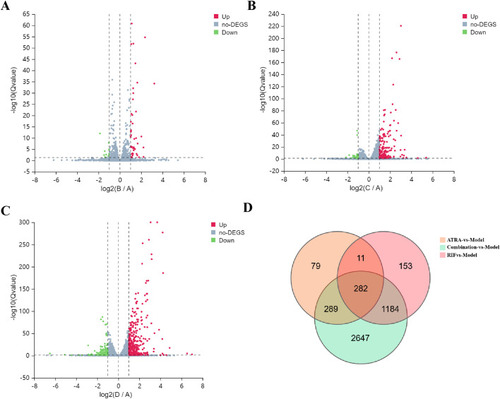
Transcriptomic profiling of differentially expressed genes (DEGs) across treatment groups. |
Expression Data
Expression Detail
Antibody Labeling
Phenotype Data
Phenotype Detail
Acknowledgments
This image is the copyrighted work of the attributed author or publisher, and
ZFIN has permission only to display this image to its users.
Additional permissions should be obtained from the applicable author or publisher of the image.
Full text @ Front Pharmacol