
FIGURE
Figure 1
- ID
- ZDB-FIG-250801-107
- Publication
- Zhang et al., 2025 - Identification of Immune Hub Genes in Obese Postmenopausal Women Using Microarray and Single-Cell RNA Seq Data
- Other Figures
- All Figure Page
- Back to All Figure Page
Figure 1
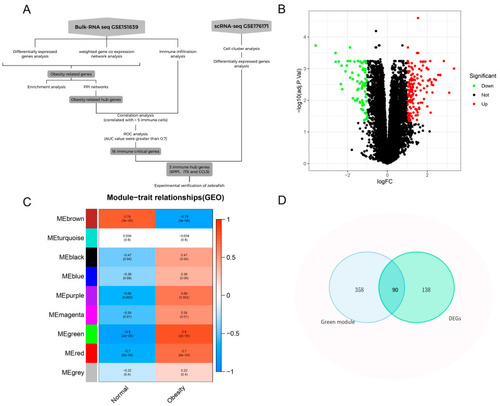
Identification of obesity-related genes. ( |
Expression Data
Expression Detail
Antibody Labeling
Phenotype Data
Phenotype Detail
Acknowledgments
This image is the copyrighted work of the attributed author or publisher, and
ZFIN has permission only to display this image to its users.
Additional permissions should be obtained from the applicable author or publisher of the image.
Full text @ Genes (Basel)