FIGURE SUMMARY
Title

Identification of Immune Hub Genes in Obese Postmenopausal Women Using Microarray and Single-Cell RNA Seq Data

Authors
Zhang, F.R., Lu, X., Li, J.L., Li, Y.X., Pang, W.W., Wang, N., Liu, K., Zhang, Q.Q., Deng, Y., Zeng, Q., Qu, X.C., Chen, X.D., Deng, H.W., Tan, L.J.
Source
Full text @ Genes (Basel)

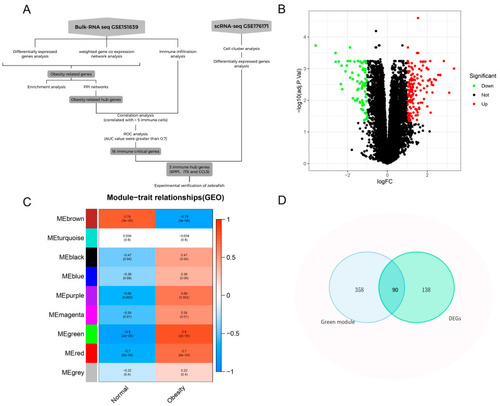
Identification of obesity-related genes. (A): Study flowchart. (B): Volcano plot of differentially expressed genes (DEGs) in adipose tissue from obese versus healthy postmenopausal women (GSE151839 microarray dataset, n = 10 per group). Red dots: significantly upregulated genes (log2FC > 1, FDR-adjusted p < 0.05); green dots: significantly downregulated genes (log2FC < −1, FDR-adjusted p < 0.05); black dots: non-significant genes. (C): Module-feature graph: Correlation between modules and obesity. (D): Venn diagram of the intersection genes of DEGs and green module genes.

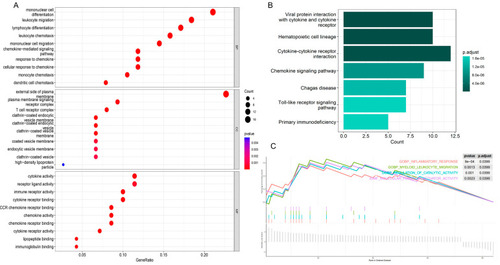
Enrichment analysis of obesity-related genes. (A): GO enrichment analysis of obesity-related genes. It is presented in three parts: biological process, cell component and molecular function. (B): KEGG enrichment analysis of obesity-related genes. (C): GSEA enrichment of obesity-related genes.

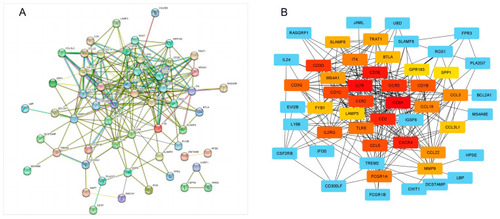
PPI network of obesity-related genes. (A): PPI network of obesity-related genes constructed using STRING database. (B): 29 hub genes were identified by MCC topological analysis algorithms using the CytoHubba plug-in (The node color is proportional to the MCC score).

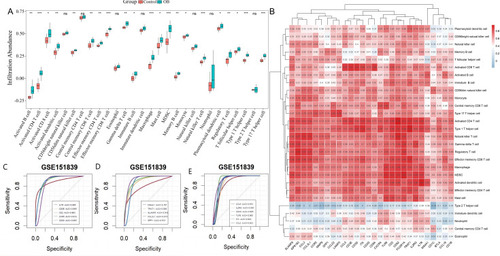
Immune infiltration analysis. (A): Results of immune infiltration analysis of microarray dataset. (B): Correlation heatmap between obesity-related hub genes and immune cell infiltration. The 16 immune-critical genes (IL7R, CD3E, CD2, CCR5, CD3D, MS4A1, TRAT1, SLAMF8, CCL3L1, SPP1, CCL5, IL2RG, CD3G, TLR8, ITK, and CCL3) are highlighted with red boxes. Color scale indicates Spearman’s correlation coefficients (blue: negative; red: positive). (CE): Screening of immune-critical genes based on ROC values. Note: Difference in expression of 28 immune cells between obese and healthy groups. * p < 0.05, ** p < 0.01, *** p < 0.001.

Single-cell RNA sequencing analysis of adipose tissue immune populations. (A): UMAP visualization of 22 cell clusters from integrated scRNA-seq data (GSE176171, n = 5 obese/5 lean postmenopausal women). Cells colored by unsupervised clustering (resolution = 0.5); (B): Cell type annotation based on canonical markers: T cells (CD3D/CD3E), B cells (MS4A1), macrophages (CD68/ADGRE1), NK cells (NCAM1/KLRD1), endothelial cells (PECAM1), and adipocyte progenitors (PDGFRA). (CE): A bar chart of immune hub genes. * p < 0.05, ** p < 0.01.

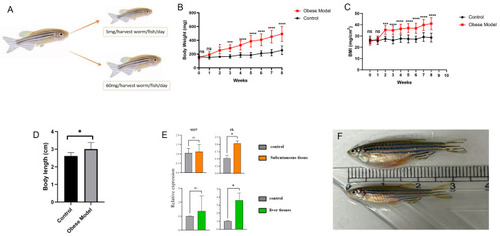
Verification of immune hub genes in zebrafish. (A): Overview of feeding zebrafish obesity model. (B): Weight changes of zebrafish during the 8-week feeding experiment. (C): Changes in BMI during feeding. (D): Changes in body length after 8 weeks of feeding. (E): qRT-PCR results of SPP1 and ITK genes; (F): Side view of normal diet and overfeeding zebrafish after 8 weeks of feeding. Note: * p < 0.05, *** p < 0.001, **** p < 0.0001.

Acknowledgments
This image is the copyrighted work of the attributed author or publisher, and ZFIN has permission only to display this image to its users. Additional permissions should be obtained from the applicable author or publisher of the image. Full text @ Genes (Basel)