FIGURE

Figure 4

ID
ZDB-FIG-250801-110
Publication
Zhang et al., 2025 - Identification of Immune Hub Genes in Obese Postmenopausal Women Using Microarray and Single-Cell RNA Seq Data
Other Figures
All Figure Page
Back to All Figure Page
Figure 4

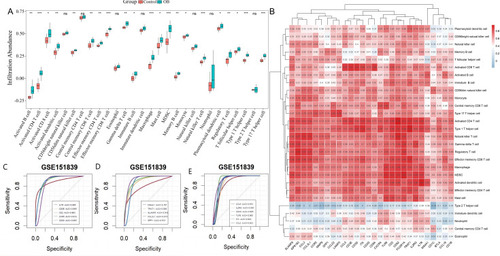
Immune infiltration analysis. (A): Results of immune infiltration analysis of microarray dataset. (B): Correlation heatmap between obesity-related hub genes and immune cell infiltration. The 16 immune-critical genes (IL7R, CD3E, CD2, CCR5, CD3D, MS4A1, TRAT1, SLAMF8, CCL3L1, SPP1, CCL5, IL2RG, CD3G, TLR8, ITK, and CCL3) are highlighted with red boxes. Color scale indicates Spearman’s correlation coefficients (blue: negative; red: positive). (CE): Screening of immune-critical genes based on ROC values. Note: Difference in expression of 28 immune cells between obese and healthy groups. * p < 0.05, ** p < 0.01, *** p < 0.001.

Expression Data

Expression Detail
Antibody Labeling
Phenotype Data

Phenotype Detail
Acknowledgments
This image is the copyrighted work of the attributed author or publisher, and ZFIN has permission only to display this image to its users. Additional permissions should be obtained from the applicable author or publisher of the image. Full text @ Genes (Basel)