|
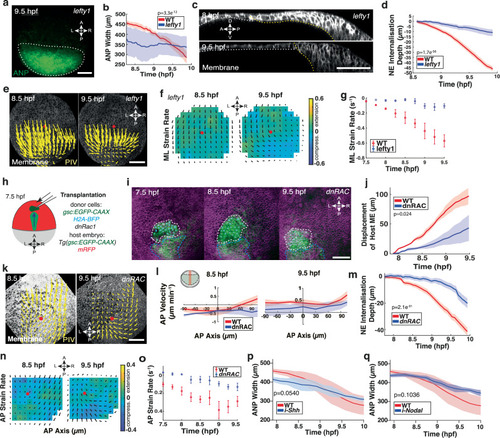
Mesendoderm migration is essential for anterior neural plate internalisation and multilayer folding. a Confocal images of neuroectoderm (NE) cells in the anterior neural plate (ANP) of Tg(otx2:Venus) lefty 1 morphants at 9.5 hpf. White dashes outline the ANP. b ANP width in WT (red) and lefty 1 (blue) morphants during gastrulation. Two-sided unpaired t-test (p = 3.3e−12). c Sagittal confocal images of the ANP in lefty 1 morphants at 8 hpf and 9.5 hpf. Dorsal (D), ventral (V), anterior (A), posterior (P) indicated. Cell membranes (mRFP) grey LUT. Yellow dashes, NE/yolk and white dashes, non-NE/yolk interface, respectively. d Internalisation depth of NE cells in WT and lefty 1 morphants during gastrulation (30 cells, 3 embryos). Two-sided unpaired t-test (p = 1.7e−56). e Average tissue flow velocities projected on confocal imaging of membrane labelled NE cells in the dorsal-most layer of the ANP in lefty 1 morphants at 8.5 hpf and 9.5 hpf. Red dot: AP axis/ANP anterior edge intersection. f Average ANP domain strain rates along the mediolateral (ML) axis of lefty 1 morphants. Strain rate minimum green, maximum stretching yellow, maximum compression blue. Black arrows: average tissue flows. Red dot: AP axis/ANP leading edge intersection. g Maximum absolute strain rates along ML axis of WT and lefty 1 morphants during gastrulation. Negative values indicate compression. h Transplantation schematic. Donor dnRac1 expressing ME cells (dark green) transplanted anterior to host ME (light green) before internalisation at 7.5 hpf. i) Confocal images (AP view) of Tg(gsc:EGFP-CAAX) host embryo (mRFP) transplanted with dnRac1 expressing ME donor cells (gsc:GFP-CAAX, H2A-BFP, white dashes), anterior to host ME (blue dashes) at 7.5 hpf and imaged throughout gastrulation (7.5–9.5 hfp). j Anterior displacement of mesendoderm in WT (red) and dnRac1 transplanted (blue) embryos. Two-sided unpaired t-test (p = 0.024). k Tissue flow of time-average velocities projected on membrane labelled NE cells in the dorsal-most layer of the ANP in transplanted embryos at 8.5 hpf and 9.5 hpf. Red dot: AP axis/ANP anterior edge intersection. l Cell velocities from (k) at 8.5 hpf and 9.5 hpf in AP direction along the dorsal midline of WT and transplanted embryos. AP velocity plots, X-axis: 0 = ANP anterior edge; negative anterior, positive posterior. Y-axis: negative posterior, positive anterior-directed flows. m NE internalisation depth of dorsal NE layer in WT and dnRac1 transplanted embryos. Two-sided unpaired t-test (p = 2.1e−31). n Average ANP domain strain rates along the AP axis of WT and dnRac1 transplanted embryos. Minimum green (0); maximum stretching yellow; maximum compression blue. Black arrows: average tissue flows. Red dot: AP axis/ANP leading edge intersections. o Maximum absolute ANP strain rates along the AP axis of WT and dnRac1 transplanted embryos during gastrulation. Negative values indicate compression. p ANP width in WT (red) and Shh inhibited (blue) embryos during gastrulation. Two-sided unpaired t-test (p = 0.0540). q ANP width in WT (red) and Nodal inhibited (blue) embryos during gastrulation. Two-sided unpaired t-test (p = 0.1036). All data are presented as the mean ± SEM of 3 embryos, unless otherwise stated. Scale bars: 100 µm. Source data are provided as a Source Data file.
|