|
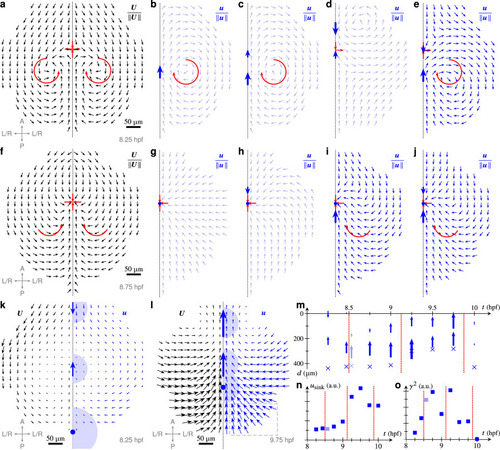
Mechanical modelling predicts spatiotemporal interplay between forces controlling tissue flows in the anterior neural plate. a Symmetrised experimental flow directions before internalisation (8.25 hpf); flow features lateral vortices and an extension point along the dorsal midline (red). Inset: embryo axes (A: anterior, P: posterior, L/R: left-right symmetrised). b Flow directions from a single, anterior directed force. Flow features a lateral vortex but no extension point. c Flow directions from two parallel force singularities; flow features a lateral vortex but no extension point. d, e Flow directions from two antiparallel force singularities. d Posterior-directed force dominates. Flow displays an extension point but incorrect vortices. e Anterior-directed force dominates. Extension point and vortices are correct. f Symmetrised experimental flow directions after internalisation initiation (8.75 hpf). Flow features an axis sink and a turning flow posterior to the sink. Vortices are lost. g Flow directions from a single sink lack the turning flow. h Flow directions from a sink and a pulling force; turning flow orientation is incorrect. i Flow directions from a sink and a drag force feature a sink and a turning flow with correct orientation. j Flow directions from a sink, drag force, and a smaller pulling force feature a sink and correct turning flow. k Experimental flow field U (left) and fitted flow field u (right) at 8.5 hpf. Arrows indicate force directions and positions; blue dot indicates sink position. Shading indicates areas over which the singularities are smeared out. Fitted sinks represent contributions from compressibility and internalisation. l Experimental and fitted flow fields at 9.75 hpf. Blue dashed area highlights underestimated left-right flows in the posterior region. m Positions of the regularised force singularities (arrows) and regularised sinks (circle) against time, given in terms of the distance d from the anterior limit of the tissue. Arrow size: force magnitude. Different fits of very similar fit scores shown for 8.5 hpf. Vertical red lines separate different mechanical regimes. n Normalised fitted sink velocity (usink) against time. Red dashes: mechanical transitions. AU arbitrary units. o Normalised fitted friction coefficient (γ2) against time. Red dashes: mechanical transitions. All scale bars, 50 µm.
|