|
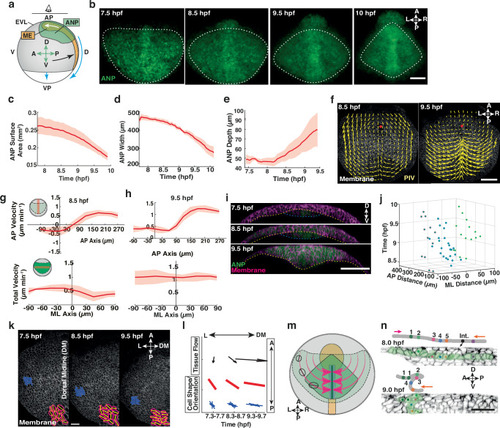
Anterior neural plate reshaping during gastrulation is driven by global tissue flows. a Schematic illustrating anterior neural plate (ANP, green), mesendoderm (ME, orange) and epithelial enveloping layer (EVL, grey) positions and movements in a zebrafish embryo during gastrulation (lateral view). Animal–vegetal pole (AP–VP) and dorsal–ventral (D–V) indicate embryo orientation. Green arrows: ANP tissue orientation, anterior (A), posterior (P), dorsal (D) and ventral (V). White arrow, ME movement; black arrow: convergent extension; blue arrow: epiboly movement. b Confocal images of ANP neuroectoderm (NE) cells in Tg(otx2:Venus) embryo during gastrulation. White dashes outline the ANP. Anterior, posterior, left (L), right (R) directions indicated. ANP surface area (c), width (d), and tissue depth (e) during gastrulation in wild type (WT) embryos. Time measured in hours post fertilisation (hpf). f Tissue flows of time-average velocities projected on membrane (mRFP) labelled NE cells in the dorsal-most layer of the ANP in WT embryos at 8.5 hpf and 9.5 hpf. Red dot: AP axis/ANP anterior edge intersection. Cell velocities from (f) at 8.5 (g) and 9.5 hpf (h) in AP direction along the dorsal midline (dm) and total velocities along mediolateral axis. AP velocity, X-axis: 0 = ANP anterior edge; negative anterior, positive posterior. Y-axis: negative posterior, positive anterior-directed flows. Total velocity, X-axis: 0 = dm; negative left, positive right. Insets: cell location in the embryo (red line). i Transverse confocal images (ventral view) of WT ANP through gastrulation. Cell membranes (mRFP, magenta) and ANP (otx2:Venus, green) labelled. Yellow dashes: NE and ME/yolk interface. Blue dashes: ME ventral edge. j Time (hfp; z-axis) and location (xy-axes) of ANP cell internalisation (61 cells, 3 embryos). Blue dots: cells along dm, red dots and green dots cells on the right and left respectively. X-axis: distance from dm (0); Y-axis: distance posterior to ANP leading edge. k Membrane-labelled NE cells in the left half of the ANP during gastrulation. Orientation and shape of NE cells originating from the lateral leading edge of the ANP at 7.5 hpf (blue). Insets: cell outlines (red) as fitted ellipses and major cell axis (yellow segment). AP and LR axes indicated. l Tissue flow orientation and cell orientation/shape from (k). Arrows indicate average tissue flow direction over 20 min around time indicated, where size indicates magnitude. Average cell orientation and shape (length, red lines) and histogram of individual cell orientations (blue lines). m Schematic of ANP (green, AP view) shape changes and underlying ME (orange) during gastrulation. Pink arrow: flows towards dm. Cell orientation/shape indicated at different time points (AP view). n Representative confocal image series and illustrations showing tracked neuroectoderm cell positions over time within a single ANP tissue layer (green pseudocolour). Coloured dots indicate single cells. Purple arrow, posterior and orange arrow, anterior movements. Internalisation (Int) start point indicated. Orientation as in (a). All data are presented as the mean ± SEM of 3 embryos, unless stated otherwise. Scale bars: 100 µm (b, f, i); 50 µm (n). Source data are provided as a Source Data file.
|