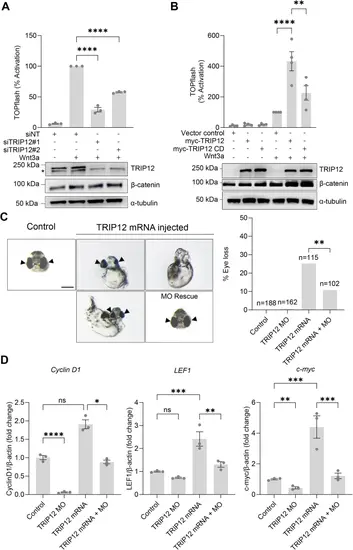
TRIP12 promotes Wnt signaling in human cells and zebrafish.A HEK293STF cells were transfected with nontargeting (siNT) or two independent TRIP12 siRNAs (siTRIP12#1 and #2) and incubated in the presence or absence of recombinant Wnt3a. TOPflash reporter activity quantified, and cell extracts immunoblotted for TRIP12 and β-catenin. α-tubulin is a loading control. *indicates a nonspecific band. Graphs show mean ± SEM of TOPflash normalized to cell number and control. Significance assessed using one-way ANOVA with Dunnett’s test. p-values for siNT + Wnt3a versus siTRIP12#1 and siTRIP12#2 are <0.0001. TOPflash and immunoblots represent at least three independent experiments. n = 3 wells of cells per treatment group per experiment, as shown in the dot plot. B HEK293STF cells transfected with empty vector control or plasmids encoding Myc-TRIP12 wild-type (WT) or Myc-TRIP12 catalytic-dead (CD) and incubated in the presence or absence of recombinant Wnt3a. TOPflash reporter activity quantified, and cell extracts immunoblotted for TRIP12 and β-catenin. α-tubulin is a loading control. Graphs show mean ± SEM of TOPflash normalized to cell number and control. Significance assessed with one-way ANOVA with Tukey’s test. p-value for myc-TRIP12 + Wnt3a versus control +Wnt3a is <0.0001 and for myc-TRIP12 + Wnt3a versus myc-TRIP12 CD + Wnt3a is 0.0028. C Zygotes injected with TRIP12 mRNA. Rescues were co-injected with TRIP12 MO. Representative images are shown on the left, with arrows indicating developing eyes. The percentage of eyeless embryos is graphed on the right. Scale bar = 200 mm. Significance analyzed by Fisher’s exact test (two-sided), p-value is 0.0081. D Co-injection with mRNA and MO rescues expression of Cyclin D1, Lef1, and c-myc. Total mRNAs isolated from injected single embryos, and Cyclin D1, Lef1, and c-myc levels quantified by RT-qPCR. Gene expression is graphed as ratio to β-actin control and normalized to uninjected embryo controls. Graphs show mean ± SEM, n = 3 independent embryo pools. Significance assessed using one-way ANOVA with Tukey’s test. p-values for Control versus TRIP12 MO, Control versus TRIP12 mRNA, TRIP12 mRNA versus TRIP12 mRNA + MO are 0.0000085, 0.092147, 0.0430227 for Cyclin D, 0.0947633, 0.0003199, 0.0033959 for Lef1, 0.0072358, 0.0002207, 0.0005341 for c-myc. *p < 0.05, **p < 0.01, ***p < 0.001, ****p < 0.0001, p ≥ 0.05 not significant (ns). Source data provided.
|
