
Fig. 3
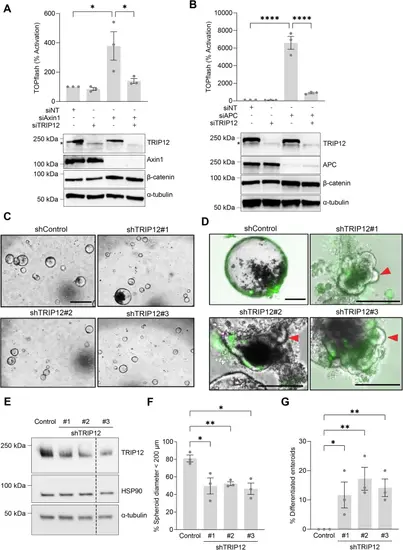
TRIP12 functions downstream of β-catenin stabilization.A HEK293STF cells were transfected as indicated with nontargeting (siNT) control, TRIP12 siRNAs, Axin siRNAs, or TRIP12 and Axin siRNAs. TOPflash reporter activity quantified, and cell extracts immunoblotted for TRIP12, Axin, and β-catenin. *indicates a nonspecific band. Graphs show mean ± SEM of TOPflash normalized to cell number and control. Significance assessed using the one-way ANOVA with Tukey’s test. p-value for siAxin1 versus siNT is 0.0167 and for siAxin1 versus siAxin1 + siTRIP12 is 0.0366. For A and B, TOPflash and immunoblots are representative of at least three independent experiments. n = 3 wells of cells per treatment group per experiment. α-tubulin is loading control. B HEK293STF cells transfected as indicated with siNT control, TRIP12 siRNAs, APC siRNAs, or TRIP12 and APC siRNAs. TOPflash reporter activity quantified, and cell extracts immunoblotted for TRIP12, APC, and β-catenin. *indicates a nonspecific band. Significance assessed using one-way ANOVA with Tukey’s test. p-values for siAPC versus siNT and siAPC versus siAPC + siTRIP12 are <0.0001. APCmin organoids infected with control shRNA (Control) or three distinct shTrip12 lentiviral particles (#1, #2, and #3), imaged, and quantified for C, F organoid diameter (<200 μm) after 3 days, and evidence of D, G differentiation (villus formation, indicated by arrowheads) after 4 days. F: n > 50 organoids per experiment, G: n > 20 organoids per experiment. Scale bar in C 800 μm, D 50 μm. D GFP marks lentivirus-infected cells. Graphs show mean ± SEM of three independent replicates. Significance for F was analyzed by two-tailed Student’s t test and p-values are 0.0338, 0.0030, 0.0103, respectively. Significance for G was analyzed by one-tailed Student’s t test and p-values are 0.0286, 0.0058, 0.0046, respectively. E Immunoblotting was performed to confirm reduction in TRIP12 levels. HSP90 and α-tubulin are loading controls. Representative images are shown (n = 3 independent experiments). The dashed line between #2 and #3 represents intervening wells. *p < 0.05, **p < 0.01, ****p < 0.0001. Source data are provided in the Source Data file. |