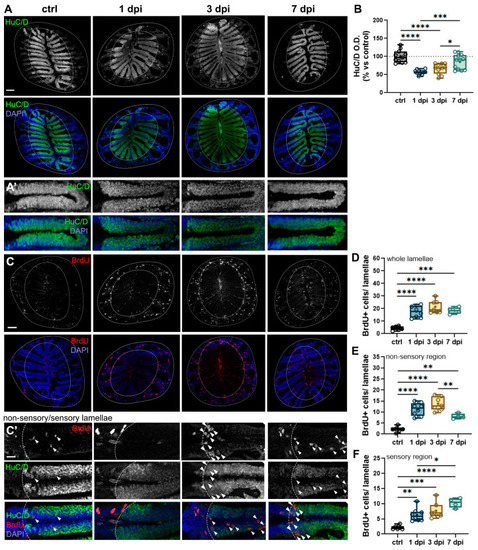
6-OHDA injections in the OB cause retrograde degeneration in the OE. (A,A′) HuC/D immunohistochemistry of OE sections from controls, 1 dpi, 3 dpi, and 7 dpi groups. (A’) are magnified views of the OSN-containing sensory lamellae (HuC/D+) from (A). Scale bars: 100 µm in (A); 20 µm in (A′). (B) Quantification of percent change (vs. control) in optical density (O.D.) of HuC/D in the OE from (A) (n = 11–12). ANOVA F (3, 41) = 16.78, p < 0.0001. ctrl vs. 1 dpi p < 0.0001, ctrl vs. 3 dpi p < 0.0001, 1 dpi vs. 7 dpi p = 0.0005, 3 dpi vs. 7 dpi p = 0.0286. (C,C′) Double immunohistochemistry of BrdU and HuC/D in sections of the OE of controls, 1 dpi, 3 dpi, and 7 dpi fish. (C′) Magnified views of (C), showing the sensory and non-sensory regions of the OE lamellae (indicated by dashed lines and HuC/D staining). BrdU+ cells found in the sensory area (HuC/D+) are indicated with white arrowheads. Red: BrdU; green: HuC/D; blue: DAPI. Scale bars: 100 µm in (C); 20 µm in (C′). (D) Quantification of BrdU+ cells in whole lamellae from (A) (n = 4–8). ANOVA F (3, 21) = 21.26, p < 0.0001. ctrl vs. 1 dpi p < 0.0001, ctrl vs. 3 dpi p < 0.0001, ctrl vs. 7 dpi p = 0.0002. (E) Quantification of BrdU+ cells in the non-sensory lamellae from (A) (n = 4–8). ANOVA F (3, 21) = 25.83, p < 0.0001. ctrl vs. 1 dpi p < 0.0001, ctrl vs. 3 dpi p < 0.0001, ctrl vs. 7 dpi p = 0.0073, 3 dpi vs. 7 dpi p = 0.0075. (F) Quantification of BrdU+ cells in the sensory lamellae (HuC/D+) from (A) (n = 4–8). ANOVA F (3, 21) = 14.86, p < 0.0001. ctrl vs. 1 dpi p = 0.0046, ctrl vs. 3 dpi p = 0.0004, ctrl vs. 7 dpi p < 0.0001, 3 dpi vs. 7 dpi p = 0.0075, 1 dpi vs. 7 dpi p = 0.0205. Box plots indicate mean (+), quartiles (boxes) and range (whiskers). One-way ANOVA, * p < 0.005, ** p < 0.001, *** p = 0.0009, **** p < 0.0001.
|
