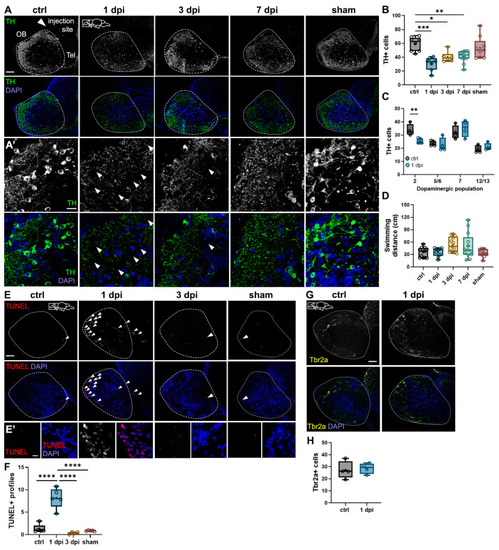
Effects of 6-OHDA injections on the zebrafish brain. (A,A′) Tyrosine hydroxylase (TH) immunohistochemistry of sagittal sections of the OB from control, 1-day post-injection (dpi), 3 dpi, 7 dpi, and sham fish. 6-OHDA injection site at the dorsal telencephalic ventricle near the telencephalon (Tel) is shown with a white arrowhead in the top left panel. Dotted lines indicate the OB. (A′) Magnified views of (A). Increased spacing in TH+ staining is indicated with white arrowheads. Green: TH; blue: DAPI. Scale bars: 100 µm in (A); 20 µm in (A′). (B) Quantification of the average number of TH+ cells in sagittal sections of the OB from (A) (n = 6–11). ANOVA: F (4, 36) = 8.34, p < 0.0001. ctrl vs. 1 dpi p = 0.0001, ctrl vs. 3 dpi p = 0.0025, ctrl vs. 7 dpi p = 0.0088. (C) Quantification of the average number of TH+ cells in dopaminergic populations 2, 5/6, 7, and 12/13 from sagittal sections of control and 1 dpi fish (n = 4). For population 2: t = 3.883, df = 7, p = 0.0060. (D) Quantification of swimming responses in control, 1 dpi, 3 dpi, 7 dpi, and sham fish (n = 9–12). (E) (TdT) dUTP Nick-End Labeling (TUNEL) staining in sagittal sections of the OB from control, 1 dpi, 3 dpi, and sham groups. TUNEL+ profiles are indicated with white arrowheads. Red: TUNEL; blue: DAPI. Scale bars: 100 µm in (E); 20 µm in (E′). (F) Quantification of average TUNEL+ profiles in OB sections from (E) (n = 4–5). ANOVA: F (3, 15) = 40.03, p < 0.0001. ctrl vs. 1 dpi p < 0.0001, 1 dpi vs. 3 dpi p < 0.0001, 1 dpi vs. sham p < 0.0001. (G) Tbr2a immunohistochemistry of sagittal sections of the OB from control and 1 dpi groups. Yellow: Tbr2a; blue: DAPI. Scale bar: 100 µm. (H) Quantification of Tbr2a+ cells in OB sections from (G) (n = 4). Box plots indicate mean (+), quartiles (boxes) and range (whiskers). One-way ANOVA or unpaired t-test for (C), * p < 0.005, ** p < 0.001, *** p = 0.0009, **** p < 0.0001.
|
