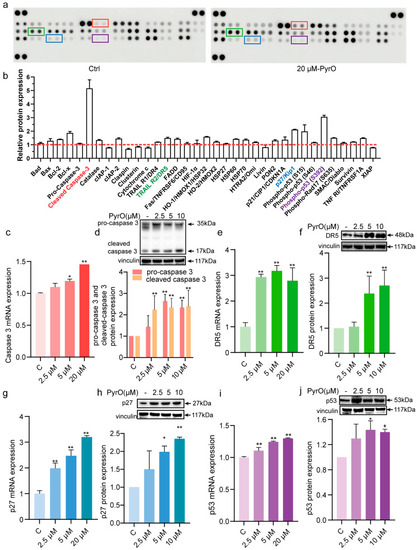
Pyripyropene O regulates the expression of apoptosis-related proteins and their mRNAs in PC-3 cells. (a,b) PC-3 cells were treated with PyrO (20 μM) for 48 h. Cells were collected and apoptosis-associated protein expression changes were detected using protein microarray kit. Red boxes indicate cleaved caspase 3 protein, green boxes indicate TRAIL R2/DR5 protein, blue boxes indicate p27/Kip1 protein, and purple boxes indicate phospho-p53(S392) protein. The red dotted line indicates Baseline (Negative Control). (c) After treating PC-3 cells with different concentrations of PyrO (0–20 μM) for 48 h, total RNA was collected, and the changes in caspase 3 mRNA expression were detected by qPCR after reverse transcription. (d) After treating PC-3 cells with different concentrations of PyrO (0–20 μM) for 48 h, total proteins were collected, and changes in caspase 3 protein expression were detected by western blot. (e) After treating PC-3 cells with different concentrations of PyrO (0–20 μM) for 48 h, total RNA was collected, and the changes in DR5 mRNA expression were detected by qPCR after reverse transcription. (f) After treating PC-3 cells with different concentrations of PyrO (0–20 μM) for 48 h, total proteins were collected, and changes in DR5 protein expression were detected by western blot. (g) After treating PC-3 cells with different concentrations of PyrO (0–20 μM) for 48 h, total RNA was collected, and the changes in p27 mRNA expression were detected by qPCR after reverse transcription. (h) After treating PC-3 cells with different concentrations of PyrO (0–20 μM) for 48 h, total proteins were collected, and changes in p27 protein expression were detected by western blot. (i) After treating PC-3 cells with different concentrations of PyrO (0–20 μM) for 48 h, total RNA was collected, and the changes in p53 mRNA expression were detected by qPCR after reverse transcription. (j) After treating PC-3 cells with different concentrations of PyrO (0–20 μM) for 48 h, total proteins were collected, and changes in p53 protein expression were detected by western blot. * p < 0.05, ** p < 0.01 vs. Ctrl.
|
