FIGURE

Figure 2

ID
ZDB-FIG-250528-41
Publication
Fang et al., 2025 - Targeting YY1-DR5 Axis by Pyripyropene O as a Novel Therapeutic Strategy Against Prostate Cancer: Molecular Mechanisms and In Vivo Zebrafish Validation
Other Figures
All Figure Page
Back to All Figure Page
Figure 2

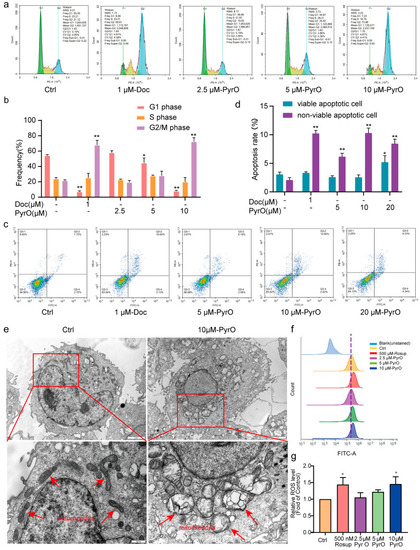
Effects of PyrO on PC-3 cell cycle and apoptosis. (a,b) PyrO blocked PC-3 cells in G2/M phase. Flow cytometry was used to detect changes in the distribution of the PC-3 cell cycle after treatment of PC-3 cells with different concentrations of PyrO for 48 h. (c,d) Effect of PyrO on apoptosis of PC-3 cells. After PyrO (0–20 uM) treatment for 48 h, the cells were stained with Annexin V-FITC/PI, and then the apoptosis was detected by flow cytometry. (e) Effect of PyrO on the internal structure of cells. 10 μM PyrO treated PC-3 cells for 48 h, then the cells were collected to observe the changes in the internal ultrastructure of the cells using transmission electron microscopy to analyze the mode of cell death. The red arrows in the image indicate the location of the mitochondria. (f,g) Effect of PyrO on intracellular ROS levels in PC-3 cells. DCFH-DA fluorescent probe combined with flow cytometry was used to detect the changes in intracellular reactive oxygen species (ROS) levels in PC-3 cells after treatment with different concentrations of PyrO (0–10 μM) for 48 h. * p < 0.05, ** p < 0.01 vs. Ctrl.

Expression Data

Expression Detail
Antibody Labeling
Phenotype Data

Phenotype Detail
Acknowledgments
This image is the copyrighted work of the attributed author or publisher, and ZFIN has permission only to display this image to its users. Additional permissions should be obtained from the applicable author or publisher of the image. Full text @ Mar. Drugs