
Fig. 5
- ID
- ZDB-FIG-250526-51
- Publication
- Kim et al., 2025 - Cohesin organizes 3D DNA contacts surrounding active enhancers in C. elegans
- Other Figures
- All Figure Page
- Back to All Figure Page
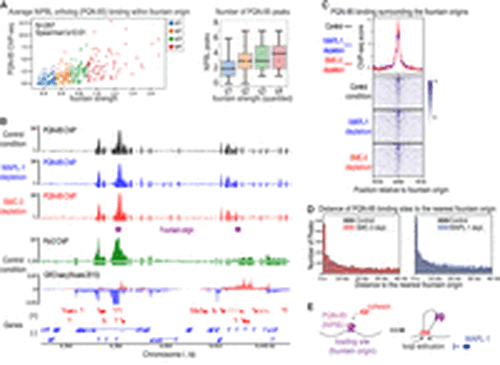
PQN-85 correlates with fountain strength, and its binding remains unchanged upon SMC-3 and WAPL-1 depletion. (A, left) Scatterplot of fountain strength versus mean PQN-85 ChIP-seq enrichment in control condition. Fountains divided into quartiles based on their strength are shown in different colors. (Right) Boxplot of fountain strength (divided into quantiles) and the number of PQN-85 summits within 6 kb region. (B) Genome browser view around fountain origins. Plotted are the input-subtracted ChIP-seq tracks for PQN-85 in three conditions: control (black), WAPL-1 depletion (blue), and SMC-3 depletion (red). The ticks below signal tracks indicate MACS2 called peaks. Fountain origins are shown in purple. (C) Average profile and heatmap of PQN-85 with respect to fountain origins. Plotted are the input-subtracted ChIP-seq tracks for cohesin subunits, SMC-3 and SMC-1, in three conditions: control (black), WAPL-1 depletion (blue), and SMC-3 depletion (red). (D) Histogram of the distance between PQN-85 summit and the nearest fountain origin. The three conditions are control (gray), WAPL-1 depletion (blue), and SMC-3 depletion (red). (E) Cartoon model of cohesin moving away from fountain origins without PQN-85 as it performs two-sided loop extrusion. |