
FIGURE
Fig. 4
- ID
- ZDB-FIG-250430-141
- Publication
- Arnold et al., 2025 - Protocol to computationally average confocal images of zebrafish lymphatic vessels to identify phenotypes
- Other Figures
- All Figure Page
- Back to All Figure Page
Fig. 4
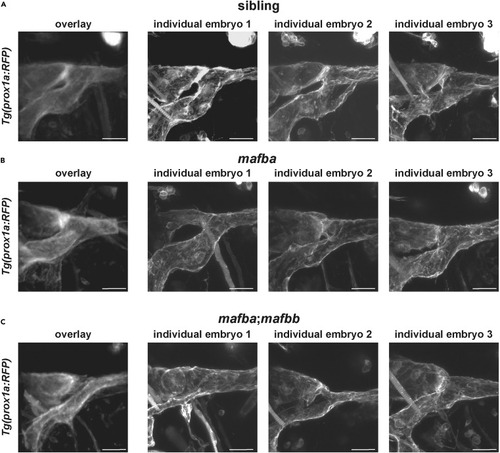
Resulting overlayed z-stacks and individual z-stacks (A–C) Maximum projections that result from overlaying multiple images and the individual maximum projections that are input to the overlay for siblings (A), mafba mutants (B) and mafba;mafbb double mutants (C). Scale bar = 25 μm. |
Expression Data
Expression Detail
Antibody Labeling
Phenotype Data
Phenotype Detail
Acknowledgments
This image is the copyrighted work of the attributed author or publisher, and
ZFIN has permission only to display this image to its users.
Additional permissions should be obtained from the applicable author or publisher of the image.
Full text @ STAR Protoc