
Image
|
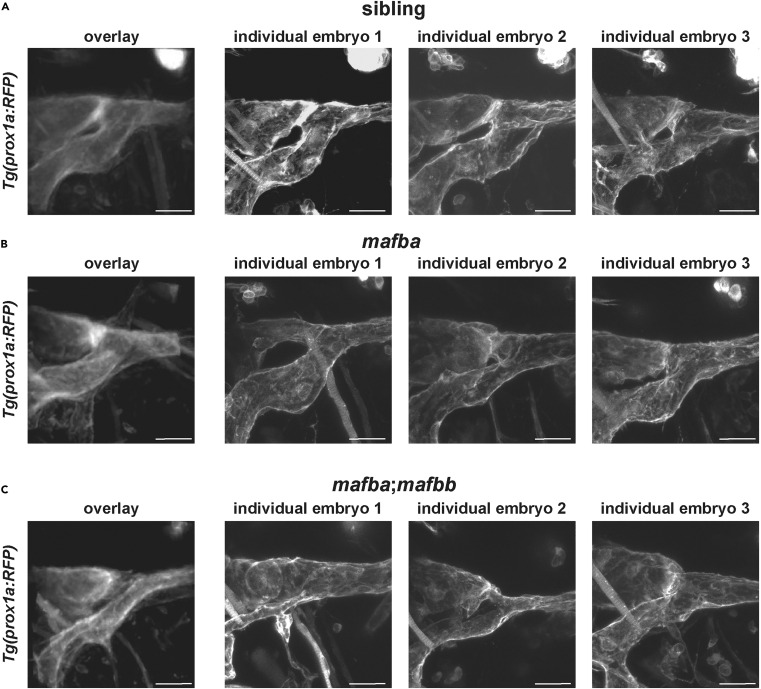
Figure Caption
Fig. 4 Resulting overlayed z-stacks and individual z-stacks (A–C) Maximum projections that result from overlaying multiple images and the individual maximum projections that are input to the overlay for siblings (A), mafba mutants (B) and mafba;mafbb double mutants (C). Scale bar = 25 μm.
Acknowledgments
This image is the copyrighted work of the attributed author or publisher, and
ZFIN has permission only to display this image to its users.
Additional permissions should be obtained from the applicable author or publisher of the image.
Full text @ STAR Protoc