
Fig. 2
- ID
- ZDB-FIG-250430-139
- Publication
- Arnold et al., 2025 - Protocol to computationally average confocal images of zebrafish lymphatic vessels to identify phenotypes
- Other Figures
- All Figure Page
- Back to All Figure Page
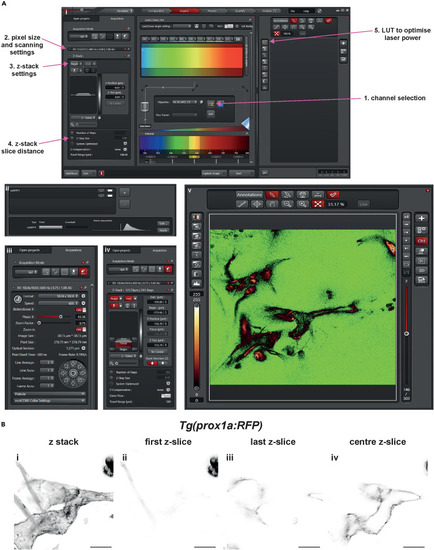
Imaging set up on LasX software (A) Screen shots of LasX software to demonstrate settings for image acquisition. (i) [1] channel selection – to open the selector for the PMT or HyD laser shown in (ii). [2] Selector for pixel size and scanning settings, shown in further details in (iii). [3] z-stack settings – to set the range on the z-axis for imaging, shown in further details in (iv). [4] z-stack slice distance – distance between each z-slice, further detail in (iv). [5] Look up table (LUT) to ensure there are no saturated pixels through the z-stack, demonstrated in (v). (B) Example of z-stack set up and outcome. (i) Final z-stack with valve structure centralized. (ii) First z-slice of the z-stack, lateral to the lymphatic vessel. (iii) Last z-slice of the z-stack, medial to the lymphatic vessel. (iv) Centre of the z-stack where the structure of interest, the valve, is visible. Scale bar = 25 μm. |