
Fig. 2 - Supplemental 2
- ID
- ZDB-FIG-250424-32
- Publication
- Scerbo et al., 2025 - In vivo targeted and deterministic single-cell malignant transformation
- Other Figures
- All Figure Page
- Back to All Figure Page
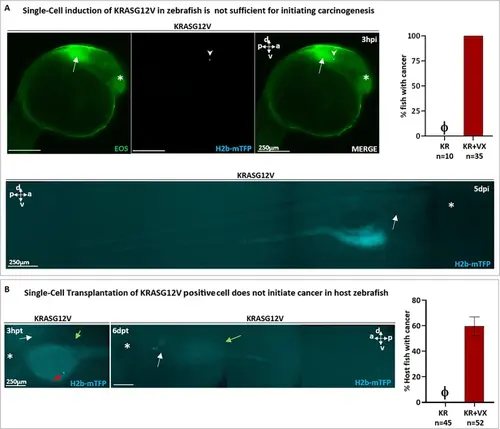
Single-cell activation of the KRASG12V oncogene is not sufficient to initiate carcinogenesis. (A) At 1 day post-fertilization (dpf), a single cell in the brain was photo-induced to express the oncogene kRasG12V and identified (white arrowhead) within ~30 min by the blue fluorescence of the expression marker (H2b-mTFP). The otic vesicle (indicated by white arrow) is used as a spatial reference. At 5 days post-induction (5 dpi), the activated cell has disappeared. Note in the graph that, whereas KRASG12V plus VENTX (KR+VX) efficiently induces cancer (100%), KRASG12V alone (KR) is not sufficient (0%, indicated by Φ). (B) Expression of kRasG12V was activated in 1 dpf embryos (without subsequent activation of Ventx). The cells of the larvae were dissociated and isolated cells (kRas expressing, H2b-mTFP+ blue cells) were transplanted (≈ 1 cell per host) at 2 dpf in a Nacre (mitf -/-) zebrafish line for a better tracking of the transplanted cells. The transplanted H2b-mTFP+ blue cell (red arrow) can be visualized as early as 3 hr post-transplantation (3 hpt) in the yolk of the host. At 6 dpt the blue cell has disappeared in host Nacre zebrafish larvae. Note in the graph that, whereas the transplanted cell experiencing KRASG12V plus VENTX (KR+VX) activation efficiently give rise to cancer (60%), KRASG12V alone (KR) is not sufficient to initiate cancer in host zebrafish (0%, indicated by Φ). In all figures, the otic vesicle (white arrow) is indicated as well as the eye (white asterisk: *). Scale bars and body axes (a: anterior; p: posterior; d: dorsal; v: ventral; l: left; r: right) are shown. |