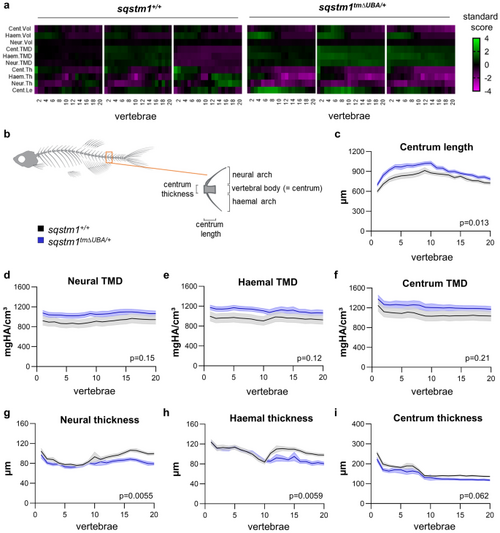
Quantitative µCT analysis using FishCuT of sqstm1tmΔUBA zebrafish at 12 mpf. a Heatmaps representing the specific FishCuT parameters for 3 individual animals per group. The standard score represents the difference between a value of a parameter in each vertebral body and the mean value of that parameter across all vertebrae in the wild-type population, divided by the standard deviation across all vertebrae in wild-type zebrafish. b Schematic overview of the different FishCuT parameters measured in the vertebral column of each vertebral body. c Quantification of the vertebral centrum length in sqstm1+/+ and sqstm1tmΔUBA/+ animals at 12 mpf (n = 9/genotype) d Quantification of the TMD at the neural arches and spines, e hemal arches and spines, and f centrum of the same zebrafish. g Quantification of the thickness of the neural arches/spines, h the hemal arches/spines, and i the centrum of the different vertebral bodies of the same zebrafish. Data are shown as mean ± SEM and statistical analysis was performed using the global test with p ≤ 0.05 considered significant. TMD, tissue mineral density
|
