
Fig. 4
- ID
- ZDB-FIG-250401-33
- Publication
- Korenkova et al., 2024 - Tunneling nanotubes enable intercellular transfer in zebrafish embryos
- Other Figures
- All Figure Page
- Back to All Figure Page
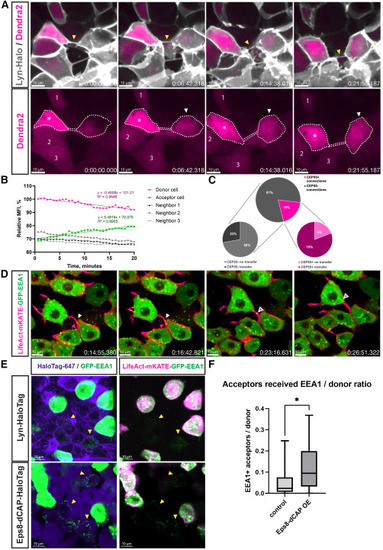
TNT-like structures are able to transfer material (A) Time-lapse recording of the zebrafish embryo at 8 hpf shows two cells connected by a membranous TNT-like connection (yellow arrowhead). Cytoplasmic Dendra2 was photoconverted to red in the cell on the left (white asterisk), the cell on the right (white arrowhead) receives red labeling within 20 min, while the fluorescence intensity of other neighboring cells (1, 2, and 3) is not changed. (B) Relative mean fluorescent intensity (MFI) quantification for time-lapse (A). Linear regression fitting for donor and acceptor cells performed in GraphPad Prism software, with equations and goodness of fit (R2) visualized on the graph. (C) Relative numbers of transferring and non-transferring connections in accordance with the proportions of CEP55-positive cytokinetic bridges and CEP55-negative TNT-like connections (upper chart: n = 141 connections; lower charts: CEP55-negative n = 25 connections, CEP55-positive n = 21 connections). (D) Time-lapse recording of the zebrafish embryo at 8 hpf shows two cells connected by an actin-positive TNT-like connection, which enables the transfer of early endosomes. The white arrowhead points the vesicles that were already present in the connection at the beginning of the recording, while the magenta arrowhead points the vesicles that entered the connection from the connected cell below. (E) Representative images showing violet Lyn-HaloTag 647 or Eps8-dCAP-HaloTag 647 acceptor cells containing green dots of EEA1-positive vesicles (yellow arrowheads). The green signal in the left panels was enhanced compared to the right panels to better visualize vesicles in the acceptor cells. (F) Quantification of the relative amount of acceptor cells (normalized to the amount of donor cells) that received EEA1-positive vesicles. Control group: n = 17 embryos, median 0.02344, Eps8-dCAP overexpression group: n = 18 embryos, median 0.09467. p = 0.0184, analyzed using the Mann-Whitney test. Box lines show medians, box edges represent quartiles, and whiskers - minimal to maximal values. Scale bars are 10 μm; time is indicated as: h:mm:ss. |
Reprinted from Developmental Cell, 60, Korenkova, O., Liu, S., Prlesi, I., Pepe, A., Albadri, S., Del Bene, F., Zurzolo, C., Tunneling nanotubes enable intercellular transfer in zebrafish embryos, 524-534.e3, Copyright (2024) with permission from Elsevier. Full text @ Dev. Cell