
Fig. 3
- ID
- ZDB-FIG-250401-32
- Publication
- Korenkova et al., 2024 - Tunneling nanotubes enable intercellular transfer in zebrafish embryos
- Other Figures
- All Figure Page
- Back to All Figure Page
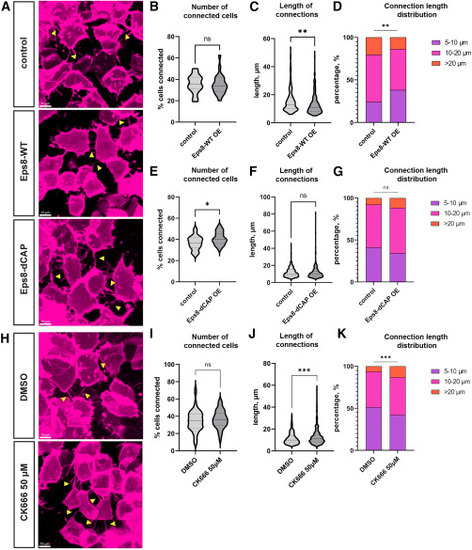
Effect of TNT inducers on zebrafish intercellular connections (A–G) Effect of overexpression of Eps8-WT (A)–(D) and its mutant Eps8-dCAP (A) and (E)–(G). (A) Representative images of the zebrafish embryo cells connected by TNT-like structures (yellow arrowheads), following Eps8-WT and Eps8-dCAP overexpression. Graphs (B) and (E) represent relative numbers of connected cells, graphs (C) and (F) show violin plots of lengths of TNT-like connections, and graphs (D) and (G) represent length distributions of TNT-like connections. (B) Control group: n = 15 embryos, median 35.38%; Eps8-WT overexpression group: n = 22 embryos, median 33.77%. p = 0.6521, analyzed using the Mann-Whitney test. (C) Control group: n = 220 connections, mean 15.30 μm; Eps8-WT overexpression group: n = 247 connections, mean 12.99 μm. p = 0.0011, analyzed using a t test. (D) Control group: n = 220 connections; Eps8-WT overexpression group: n = 247 connections, p = 0.0030, analyzed using the chi-squared test. (E) Control group: n = 23 embryos, median 36.71%; Eps8-dCAP overexpression group: n = 28 embryos, median 40.19%. p = 0.0436, analyzed using the Mann-Whitney test. (F) Control group: n = 343 connections, mean 11.77 μm; Eps8-dCAP overexpression group: n = 489 connections, mean 11.20 μm. p = 0.1717, analyzed using a t test. (G) Control group: n = 343 connections; Eps8-dCAP overexpression group: n = 489 connections, p = 0.0516, analyzed using the chi-squared test. (H–K) Effect of CK666 treatment of the embryo on TNT-like connections. (H) Representative images of the zebrafish embryo cells connected by TNT-like structures (yellow arrowheads), following CK666 treatment. (I) Relative numbers of connected cells. DMSO control group: n = 57 embryos, median 34.88%; CK666 50 μM group: n = 44 embryos, median 36.21%, p value is >0.9999, analyzed using the Mann-Whitney test. (J) Average length of TNT-like connections. DMSO control group: n = 541 connections, mean 11.29 μm; CK666 50 μM group: n = 328 connections, mean 12.90 μm, p value is <0.0001, analyzed using a t test. (K) TNT length distribution. DMSO control group: n = 541 connections; CK666 50 μM group: n = 328 connections, p = 0.0008, analyzed using the chi-squared test. |
Reprinted from Developmental Cell, 60, Korenkova, O., Liu, S., Prlesi, I., Pepe, A., Albadri, S., Del Bene, F., Zurzolo, C., Tunneling nanotubes enable intercellular transfer in zebrafish embryos, 524-534.e3, Copyright (2024) with permission from Elsevier. Full text @ Dev. Cell