
Fig. 4
- ID
- ZDB-FIG-250324-25
- Publication
- Qian et al., 2025 - Toxic effects of prolonged propofol exposure on cardiac development in zebrafish larvae
- Other Figures
- All Figure Page
- Back to All Figure Page
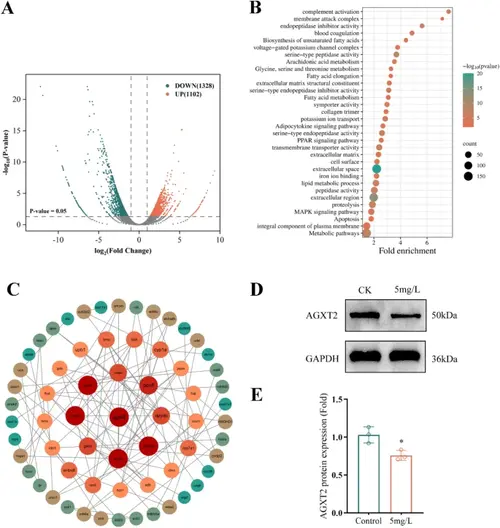
Transcriptome sequencing and differential gene analysis between 5 mg/L propofol-treated and control groups in zebrafish embryos. (A). The volcano plot highlights genes significantly altered in propofol-treated groups compared to controls (P-values < 0.05, fold change > 2). Cyan and orange indicate down-regulated and up-regulated genes, respectively. (B). GO and KEGG enrichment analysis comparing control and propofol treatment groups. (C). The PPI network of DEGs. The PPI network was displayed by Cytoscape software. The hub genes were chosen based on a higher number of associations with other genes. (D) and (E). The protein expression of the hub gene AGXT2 was confirmed by western blot |