
- Title
-
Toxic effects of prolonged propofol exposure on cardiac development in zebrafish larvae
- Authors
- Qian, S., Liu, H., Wei, H., Liu, J., Li, X., Luo, X.
- Source
- Full text @ BMC Anesthesiol

Propofol causes noticeable developmental toxicity in zebrafish larvae. Survival rates (A), hatching rates (B) and malformation rates (C) of zebrafish embryos exposed to propofol at 24, 48, 72, 96 and 120 hpf. Data shown as the means ± standard deviation (SD), (n = 3). *p < 0.05, **p < 0.01, ***p < 0.001 vs. control |
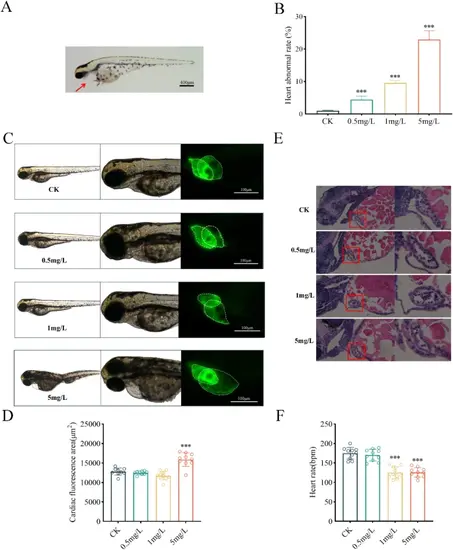
Propofol alters heart structure and function (heart rate) in zebrafish larvae. (A). Propofol-induced pericardial cyst in zebrafish larvae at 96hpf. (B). The incidence of propofol-induced heart malformations rose with higher concentrations. Cardiac malformations are defined as the observation of pericardial edema, abnormal chamber size, pericardial extension, and irregular heart morphology. (C). Cardiac morphology changes in Tg [myl7:eGFP] zebrafish larvae exposed to varying propofol concentrations included reduced atrioventricular overlap, prolonged pericardium, and enlarged cardiac cavity area. (D). Cardiac fluorescence area. (E). Representative images of HE-stained zebrafish embryo hearts following propofol exposure. (F). Heart rate changes in zebrafish larvae treated with different concentrations of propofol. Data are presented as the means ± SD of at least three independent experiments. Student’s t-test statistical analysis. ***p < 0.001 vs. control |
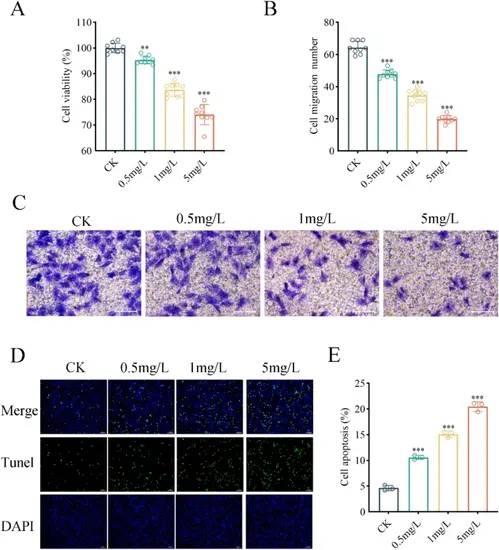
Propofol inhibits H9C2 cardiomyocyte viability, migration, and induces apoptosis. Propofol inhibited cell viability (A) and migration (B) in a concentration-dependent manner. Representative images from Transwell assays (C) illustrate its impact on cell migration, and Tunel assays (D) demonstrate propofol-induced apoptosis, which increased with higher concentrations (E). Data shown as the means ± SD, (n = 3). Scale bars = 50 μm. **p < 0.01, ***p < 0.001 vs. control |
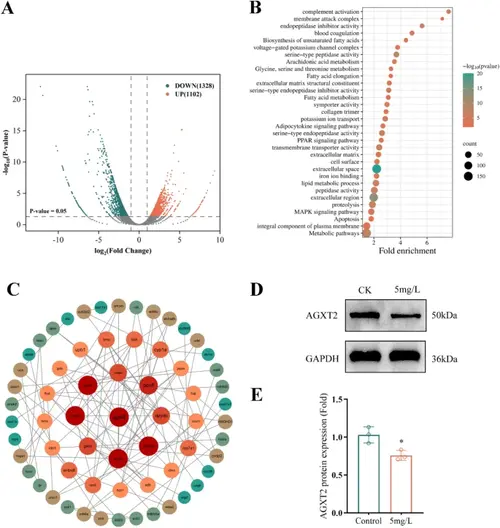
Transcriptome sequencing and differential gene analysis between 5 mg/L propofol-treated and control groups in zebrafish embryos. (A). The volcano plot highlights genes significantly altered in propofol-treated groups compared to controls (P-values < 0.05, fold change > 2). Cyan and orange indicate down-regulated and up-regulated genes, respectively. (B). GO and KEGG enrichment analysis comparing control and propofol treatment groups. (C). The PPI network of DEGs. The PPI network was displayed by Cytoscape software. The hub genes were chosen based on a higher number of associations with other genes. (D) and (E). The protein expression of the hub gene AGXT2 was confirmed by western blot |