
Figure 5.
- ID
- ZDB-FIG-250311-44
- Publication
- Xing et al., 2025 - scLTNN: an innovative tool for automatically visualizing single-cell trajectories
- Other Figures
- All Figure Page
- Back to All Figure Page
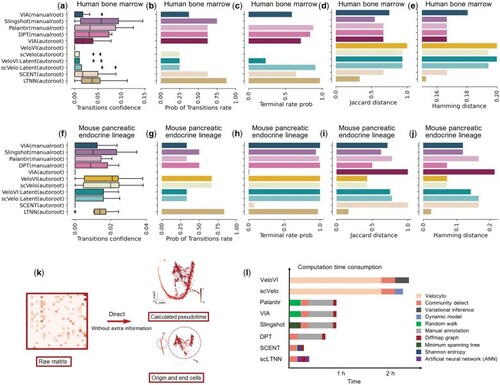
scLTNN exhibits a superior performance in trajectory inference. (a–e) Evaluating the performance of the indicated methods in inferring the trajectory of human hematopoietic cell differentiation, which includes the following pathways: HSC_1->HSC_2->Precursors->Mono_1->Mono_2->DCs, HSC_1->Ery_1->Ery_2, and HSC_1->Mega. (a) The confidence level of indicated methods for cell type transformation during human bone marrow hematopoietic differentiation is variable. If the transformation fails, the confidence level is set to 0, indicating no assurance of successful differentiation. (b) The rate of successful cell transformation is calculated from the percentage of transformation confidence nodes that are not 0 in the overall transformation confidence nodes (see details in Section 2). (c) The terminal cell prediction probability refers to the likelihood of a terminal cell appearing in the proposed chronology after 95% of the proposed chronology has been calculated. This probability provides an estimate of the potential for a terminal cell to occur within the remaining 5% of the chronology. (d) The Jaccard distance, calculated as one minus the size of the intersection of the sets divided by the size of their union, reflecting the distance from the real transformation. (e) The Hamming distance measures the difference between two sequences of equal length by counting the number of positions at which the corresponding elements are different, also reflecting the distance from the real transformation. (f–j) Evaluating the performance of the indicated methods in inferring the trajectory of mouse pancreatic endocrine lineage, which includes the following pathways: Ngn3 low EP-> Ngn3 high EP-> Pre-endocrine->Alpha/Beta/Delta/Epsilon. The analysis of the transition confidence (f), the transition rate (g), the terminal cell prediction probability (h), the Jaccard distance (i), and the Hamming distance (j) were similar to those in (a–e). (k) Sketch map of pseudotime inference. (l) Computation time consumed by distinct pseudotime inference methods. Although velocyto-dependent models (e.g. VeloVI, scVelo) do not need prior knowledge of the biological process for manual annotation of the origin and end markers, they do need Velocyto, the computationally intensive process of calculating the unspliced/spliced matrices from the bam file, usually taking anywhere 1–2 h; While other algorithms require the manual annotation, which may need literature survey and cost more time. |