
Figure 3.
- ID
- ZDB-FIG-250311-42
- Publication
- Xing et al., 2025 - scLTNN: an innovative tool for automatically visualizing single-cell trajectories
- Other Figures
- All Figure Page
- Back to All Figure Page
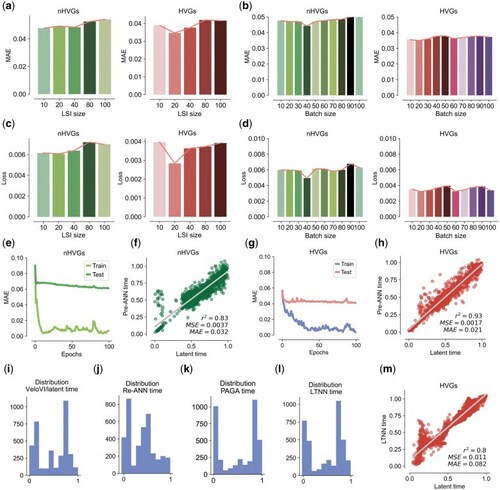
Model training of Pre-ANN and Re-ANN. (a–d) Optimization of the sizes of LSI and batch. (a) The MAE of distinct LSI sizes. (b) The MAE of distinct batch sizes. (c) The loss of distinct LSI sizes. (d) The loss of distinct batch sizes. (Left: nHVGs; Right: HVGs). (e) The MAE dramatically decreased after Pre-ANN training using nHVGs. (f) The regression of Pre-ANN time (predicted by Pre-ANN model using nHVGs) and latent time by VeloVI. (g) The MAE dramatically decreased after Pre-ANN training using HVGs. (h) The regression of Pre-ANN time (predicted by Pre-ANN model using HVGs) versus latent time (predicted by VeloVI). The distribution of latent time of the pancreas cells calculated by VeloVI (i), Re-ANN (j), PAGA (k), and LTNN (l). (m) The regression of scLTNN time versus VeloVI latent time. HVGs, high-variable genes; nHVGs, non-high-variable genes; MAE, mean absolute error; MSE, mean squared error; LTNN, latent time neural network. |