
Figure 4.
- ID
- ZDB-FIG-250311-43
- Publication
- Xing et al., 2025 - scLTNN: an innovative tool for automatically visualizing single-cell trajectories
- Other Figures
- All Figure Page
- Back to All Figure Page
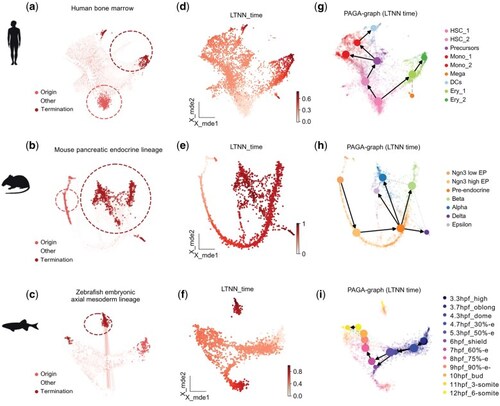
Single-cell trajectory of human bone marrow cells, mouse pancreatic endocrine lineage, and axial mesoderm lineage of zebrafish embryo depicted by scLTNN. (a–c) UMAP displaying the origin and end cells in human bone marrow cells (a), mouse pancreatic endocrine lineage (b), and axial mesoderm lineage of the zebrafish embryo (3.3–12 h) (c). (d–f) UMAP displaying the LTNN times of human bone marrow cells (d), mouse pancreatic endocrine lineage (e), and axial mesoderm lineage of the zebrafish embryo (3.3–12 h) (f). (g–i) Transition confidence using the PAGA-graph module of scLTNN model in human bone marrow cells (g), mouse pancreatic endocrine lineage (h), and axial mesoderm lineage of the zebrafish embryo from 3.3hpf to12hpf (i). |