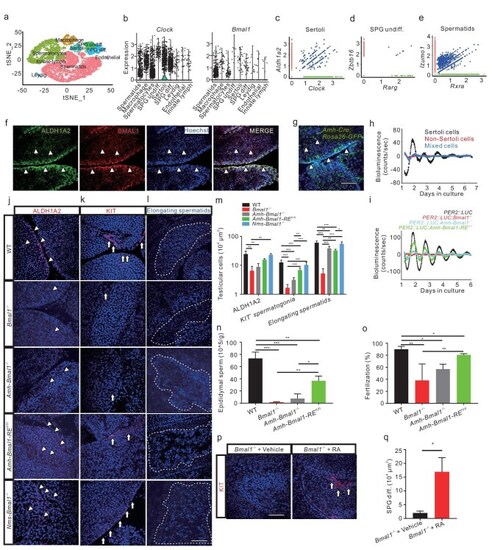
The conserved role of the Sertoli cell clock in mice. (a) scRNA-seq analysis identifies nine mouse testicular clusters (n = ∼35 000). (b) Expression of Clock and Bmal1 in the mouse testicular cell clusters. (c–e) Single-cell co-expression (blue) of Aldh1a2 (red) with Clock (green) in Sertoli cells (c), Zbtb16 (red) with Rarg (green) in SPG undiff. (d), and Izumo1 (red) with Rxra (green) in spermatids (e). (f) Confocal IHC image shows co-localization of ALDH1A2 (green) and BMAL1 (red) in Sertoli cells (n = 3 × 3). (g) Fluorescent image of EGFP-labeled Sertoli cells of Amh-ROSA26-EGFPfl/+ mice (n = 3 × 3). (h) Bioluminescence analysis of FACS-selected Sertoli cells (black), non-Sertoli cells (red) and mixed testicular cells (blue) from Amh-Rosa26-EGFPfl/+; PER2: : LUC mouse testis (n = 3). (i) Bioluminescence recordings of the testes ex vivo from PER2: : LUC (black), PER2: : LUC; Bmal1−/− (red), PER2: : LUC; Amh-Bmal1−/− (cyan), and PER2: : LUC; Amh-Bmal1-RE fl/fl(green) mice (n = 3–6). (j–l) Fluorescent images of WT control, Bmal1−/− KO, Amh-Bmal1−/−, Amh-Bmal1-RE fl/fl, and Nms-Bmal1−/− testes with ALDH1A2 (j) and KIT (k) antibodies, and their elongating spermatids (l) (n = 5–10). (m) Quantification of the images in (j–l) (n = 3–8). (n and o) Epididymal spermatozoa (n) of WT control, Bmal1−/− KO, Amh-Bmal1−/−, and Amh-Bmal1-RE fl/fl(n = 3), and fertilization rates of their sperms with WT oocytes by IVF (n = 3) (o). (p) IHC images of KIT in Bmal1−/− KO testes 1 day after atRA treatment at ZT12 (n = 4). (q) Quantification of the KIT cells in p (n = 4). (f to g, j to l, and p) ALL nuclei were counterstained with Hoechst 33342. Arrowheads indicate Sertoli cells and arrows spermatogonia. Scale bar, 100 μm. *P < 0.05; **P < 0.01; ***P < 0.001 (Figs S6 and S7).
|
