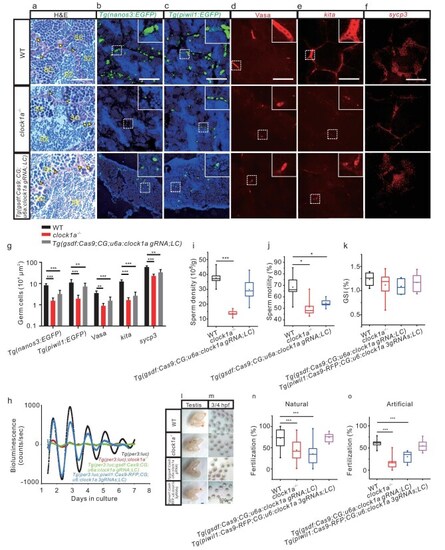
Spermatogenesis and fertilization defects in clock1a−/− and Sertoli cell clock1a mutant zebrafish. (a–f) Images of the H&E staining (a), fluorescent Tg(nanos3 : EGFP) (b) and Tg(piwil1 : EGFP) (c), IHC with a Vasa antibody (d), FISH with kita probe (e) and sycp3 probe (f) of WT control, clock1a−/−, and Sertoli cell clock1a mutant testes (n = 9–20). (g) Quantification of the images in (b–f) (n = 6–16). (h) Detrended bioluminescence recordings of the testes ex vivo from Tg(per3 : luc) (black), Tg(per3 : luc); clock1a−/− (red), Tg(per3 : luc; gsdf : Cas9; CG; u6a : clock1a gRNA; LC) (green), and Tg(per3 : luc; piwil1 : Cas9-RFP; CG; u6 : clock1a 3gRNAs; LC) (cyan) zebrafish lines (n = 3). (i and j) Sperm density (i) and motility (j) of WT control, clock1a−/−, and Sertoli cell clock1a mutant zebrafish (n = 5). (k–m) GSI (k), morphology (l), and images of fertilization at 3/4 hours postfertilization (HPF) (m) of WT control, clock1a−/−, Sertoli cell clock1a mutant, and spermatogonia clock1a mutant testes (n = 6–10). Scale bar, 500 μm. (n and o) Fertilization rates by pairwise crosses of WT control, clock1a−/−, Sertoli cell clock1a mutant, and spermatogonia clock1a mutant males with WT control females by natural crossings (n) (n = 10–24) or IVF (o) (n = 8). (a) Scale bar, 33 μm. SC, spermatocyte; SZ, spermatozoon. (b–f) Scale bar, 100 μm. (b, c) All nuclei were counterstained with Hoechst 33342. Arrowheads indicate Sertoli cells and arrows spermatogonia. *P < 0.05; **P < 0.01; ***P < 0.001 (Fig. S4 and Movie S2).
|
