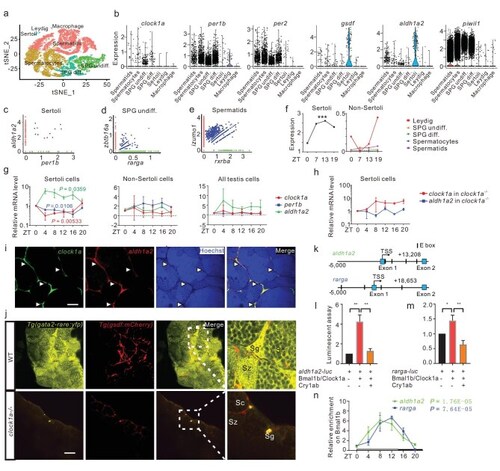
Circadian regulation of RA signaling in zebrafish. (a) scRNA-seq analysis identifies seven zebrafish testicular clusters (n = ∼32 000). (b) Expression of circadian clock genes and testicular genes in the testicular cell clusters. (c–e) Single-cell co-expression (blue dots) of aldh1a2 (red dots) with per1b (green dots) in Sertoli cells (c), ztbt16a (red dots) with rarga (green dots) in SPG undiff. (d), and izumol (red dots) with rxrba (green dots) in spermatids (e). (f) Plot of the rhythmic expression of aldh1a2 in Sertoli cells and its arrhythmic expression in non-Sertoli cells at four timepoints of a day, revealed by scRNA-seq. (g and h) qRT-PCR analyses of clock1a (red), per1b (blue), and aldh1a2 (green) with RNAs from FACS-selected Sertoli cells, non-Sertoli cells, mixed cells from testicular cells of Tg(gsdf : mCherry) (g) and Tg(gsdf : mCherry); clock1a−/− (h) (n = 3 × 3). (i) Co-localization of clock1a (green) and aldh1a2 (red) in Sertoli cells, as shown by double FISH (n = 3 × 4). All nuclei were counterstained with Hoechst 33342. Arrowheads indicate Sertoli cells. Scale bar, 50 μm. (j) Confocal images of the testes from Tg(RARE-gata2a : NLS-EYFP; gsdf : mCherry) and Tg(RARE-gata2a : NLS-EYFP; gsdf : mCherry); clock1a−/− zebrafish lines (n = 5–7). Sg, spermatogonia; Sc, spermatocyte; Sz, spermatozoon. Scale bar, 50 μm. (k) Schematic diagrams of the aldh1a2 and rarga loci harboring E-boxes. (l, m), Luciferase report assays of the aldh1a2 (l) and rarga regulatory fragments (m) (n = 3). (n) Quantitative ChIP assays (n = 2). *P < 0.05; **P < 0.01 (Fig. S3).
|
