
FIGURE
Fig. 7
Fig. 7
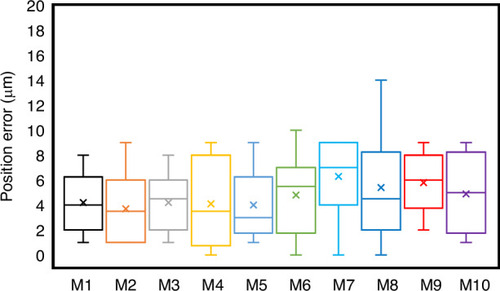
Needle tip positioning error. The 100 images were divided into 10 groups, namely M1, M2,..., M10. The start and end of the boxes denote the first and third quartiles. The band and red dot represent the median, mean, and outliers of the recorded changes, respectively. The maximum and minimum position errors are about 15 and 0 μm, respectively |
Expression Data
Expression Detail
Antibody Labeling
Phenotype Data
Phenotype Detail
Acknowledgments
This image is the copyrighted work of the attributed author or publisher, and
ZFIN has permission only to display this image to its users.
Additional permissions should be obtained from the applicable author or publisher of the image.
Full text @ Microsyst Nanoeng