
Fig. 8
- ID
- ZDB-FIG-250213-33
- Publication
- He et al., 2025 - An antagonistic role of clock genes and lima1 in kidney regeneration
- Other Figures
- All Figure Page
- Back to All Figure Page
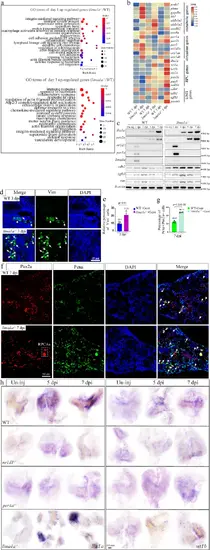
lima1a controls RPC genes via EMT.a GO terms of up-regulated genes between control and lima1a−/− kidneys at 1 and 3 dpi. b Heat map showing the expression levels of the indicated genes at the indicated time points. The RNA-seq was repeated two times, and shown were the average of the two. c Representative gel images of RT-PCR products showing the dynamic expression of the indicated genes at the indicated time points. The PCR experiments were repeated three times. d IF staining images showing the expression of Vimentin in control and lima1a−/− kidneys at the indicated time points. White arrows: Vimentin labeled cells. The experiments were repeated two times and shown were representative. e Quantification of panel d, showing the percentage of Vim+ cells. f IF staining images showing the expression of Pax2a and Pcna in control and lima1a−/− kidneys at 7 dpi. White dashed box: Pax2 expressing RPC aggregates, and white arrows: proliferating Pax2-positive cells. The experiments were repeated three times and shown to be representative. g Quantification of e (n = 5 different regions of interest per group). h Representative WISH images showing the expression of the indicated RPC marker genes at the indicated time points in control and mutant kidneys. The experiments were repeated three times and shown were from one randomly selected experiment. p-values for each panel were indicated to show the statistical significance. |