
Fig. 6
- ID
- ZDB-FIG-250213-31
- Publication
- He et al., 2025 - An antagonistic role of clock genes and lima1 in kidney regeneration
- Other Figures
- All Figure Page
- Back to All Figure Page
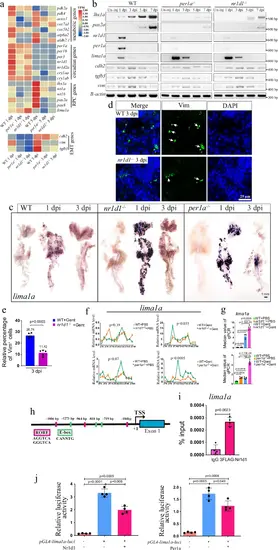
lima1a is a downstream target of the clock factorsa Heat map showing the expression of indicated genes, based on three replicates. The mesenchymal genes were placed at the bottom, and other genes were on the top. b Gel images of RT-PCR results for the indicated genes, in kidneys at the indicated time points of control, per1a−/−, and nr1d1−/− zebrafish. The RT-PCR was repeated three times, and shown were representative data. c WISH results showing the expression of lima1a at the indicated time points of control, per1a−/−, and nr1d1−/− zebrafish. WISH was repeated three times. d IF staining images of Vimentin (Vim) in 3 dpi control and nr1d1 mutant kidneys. IF experiments were repeated at least two times. e Quantification of panel d, showing the percentage of Vim+ cells. f qRT-PCR results showing the rhythmic expression of the indicated clock genes at 8 h time points over 48 h, with and without gentamicin treatment. qRT-PCR was repeated three times, and shown were representative data. g quantification of panel e. h Cartoon showing the features of lima1a gene promoter. i ChIP-PCR results showing the enrichment of Nr1d1 at lima1a promoter. The ChIP experiments were repeated two times. j Luciferase assay showing lima1a promoter activities in the presence or absence of Per1a (right) and Nr1d1 (left). The Luciferase experiments were repeated two times. p-values for each panel were indicated to show the statistical significance. ANOVA was used to test the statistical significance when multiple comparisons were conducted. |